
|
Graham Corporation (GHM) DCF Valuation |
Fully Editable: Tailor To Your Needs In Excel Or Sheets
Professional Design: Trusted, Industry-Standard Templates
Investor-Approved Valuation Models
MAC/PC Compatible, Fully Unlocked
No Expertise Is Needed; Easy To Follow
Graham Corporation (GHM) Bundle
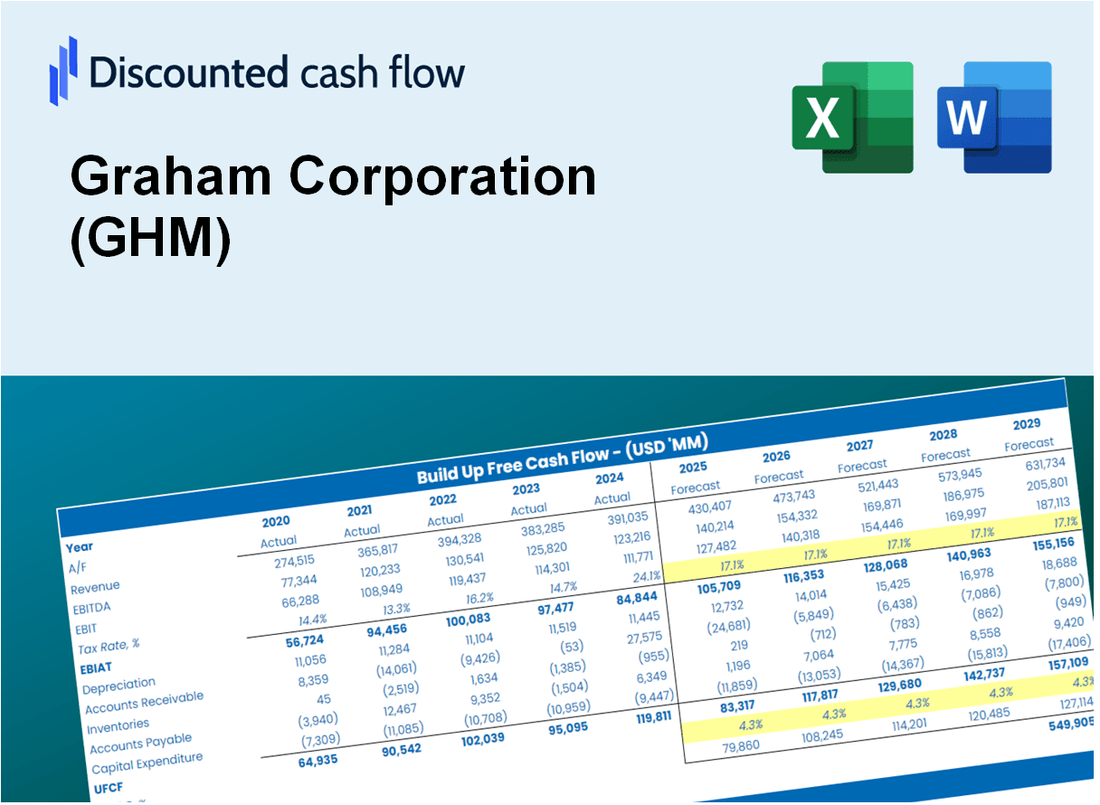
Designed for accuracy, our (GHM) DCF Calculator allows you to evaluate Graham Corporation's valuation using actual financial data, offering complete flexibility to modify all essential parameters for improved projections.
What You Will Receive
- Customizable Excel Template: A fully adjustable Excel-based DCF Calculator featuring pre-filled real GHM financials.
- Authentic Data: Historical figures and projected estimates (highlighted in the yellow cells).
- Adjustable Forecasts: Modify forecast assumptions such as revenue growth, EBITDA %, and WACC.
- Instant Calculations: Quickly observe how your inputs affect Graham Corporation’s valuation.
- Professional Resource: Designed for investors, CFOs, consultants, and financial analysts.
- Intuitive Design: Organized for clarity and ease of navigation, complete with step-by-step guidance.
Key Features
- Accurate Graham Corporation Financials: Access reliable pre-loaded historical data and future projections for GHM.
- Customizable Forecast Assumptions: Modify yellow-highlighted cells such as WACC, growth rates, and profit margins.
- Dynamic Calculations: Automatic updates to DCF, Net Present Value (NPV), and cash flow analysis for GHM.
- Visual Dashboard: User-friendly charts and summaries to help visualize your valuation results for Graham Corporation.
- For Professionals and Beginners: A straightforward, intuitive design tailored for investors, CFOs, and consultants alike.
How It Works
- Step 1: Download the Excel file.
- Step 2: Review pre-entered Graham Corporation (GHM) data (historical and projected).
- Step 3: Adjust key assumptions (yellow cells) based on your analysis.
- Step 4: View automatic recalculations for Graham Corporation’s intrinsic value.
- Step 5: Use the outputs for investment decisions or reporting.
Why Choose This Calculator for Graham Corporation (GHM)?
- Accurate Data: Utilize real financials from Graham Corporation for trustworthy valuation outcomes.
- Customizable: Tailor essential parameters such as growth rates, WACC, and tax rates to fit your forecasts.
- Time-Saving: Built-in calculations save you the hassle of starting from the ground up.
- Professional-Grade Tool: Crafted for investors, analysts, and consultants focusing on Graham Corporation.
- User-Friendly: Designed with an intuitive interface and clear instructions for all users.
Who Should Use This Product?
- Investors: Accurately assess Graham Corporation’s (GHM) fair value prior to making investment choices.
- CFOs: Utilize a professional-grade DCF model for financial reporting and analysis specific to Graham Corporation (GHM).
- Consultants: Easily modify the template for valuation reports tailored to Graham Corporation (GHM) clients.
- Entrepreneurs: Acquire insights into financial modeling practices employed by leading companies like Graham Corporation (GHM).
- Educators: Implement it as a teaching resource to illustrate valuation techniques relevant to Graham Corporation (GHM).
What the Template Contains
- Historical Data: Includes Graham Corporation’s (GHM) past financials and baseline forecasts.
- DCF and Levered DCF Models: Detailed templates to calculate Graham Corporation’s (GHM) intrinsic value.
- WACC Sheet: Pre-built calculations for Weighted Average Cost of Capital.
- Editable Inputs: Modify key drivers like growth rates, EBITDA %, and CAPEX assumptions.
- Quarterly and Annual Statements: A complete breakdown of Graham Corporation’s (GHM) financials.
- Interactive Dashboard: Visualize valuation results and projections dynamically.
Disclaimer
All information, articles, and product details provided on this website are for general informational and educational purposes only. We do not claim any ownership over, nor do we intend to infringe upon, any trademarks, copyrights, logos, brand names, or other intellectual property mentioned or depicted on this site. Such intellectual property remains the property of its respective owners, and any references here are made solely for identification or informational purposes, without implying any affiliation, endorsement, or partnership.
We make no representations or warranties, express or implied, regarding the accuracy, completeness, or suitability of any content or products presented. Nothing on this website should be construed as legal, tax, investment, financial, medical, or other professional advice. In addition, no part of this site—including articles or product references—constitutes a solicitation, recommendation, endorsement, advertisement, or offer to buy or sell any securities, franchises, or other financial instruments, particularly in jurisdictions where such activity would be unlawful.
All content is of a general nature and may not address the specific circumstances of any individual or entity. It is not a substitute for professional advice or services. Any actions you take based on the information provided here are strictly at your own risk. You accept full responsibility for any decisions or outcomes arising from your use of this website and agree to release us from any liability in connection with your use of, or reliance upon, the content or products found herein.