
|
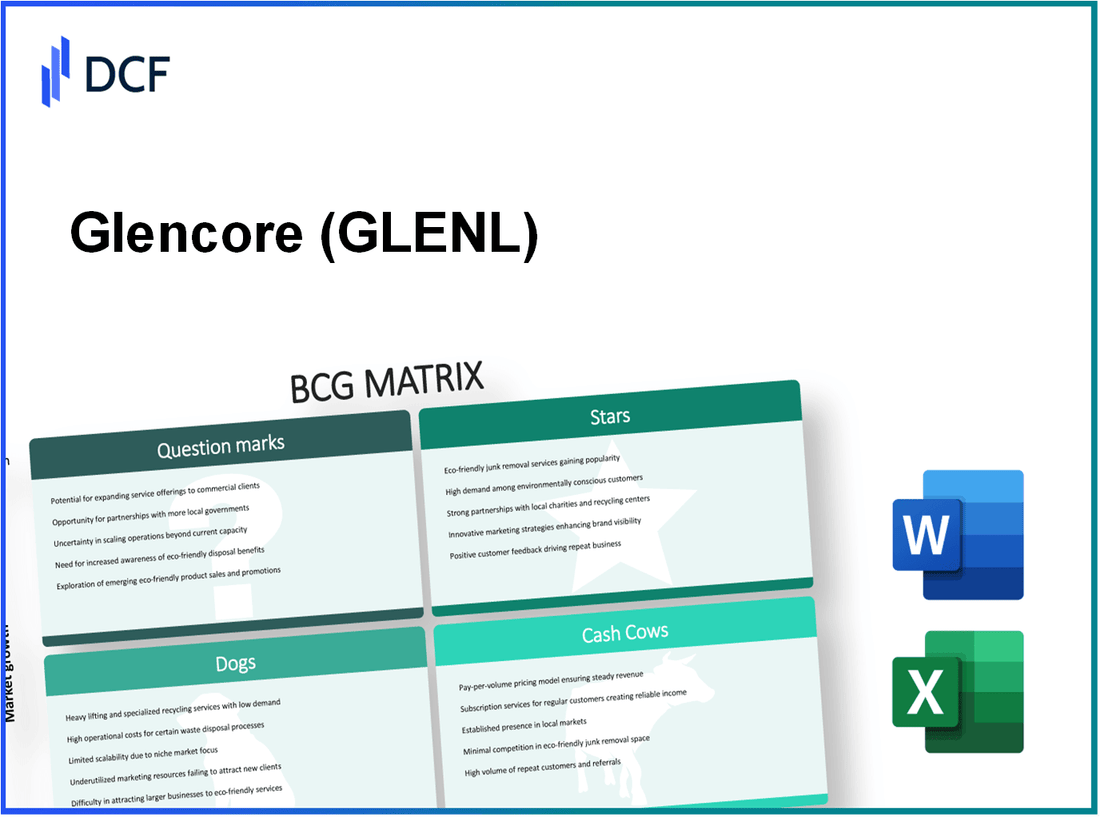
Glencore plc (GLEN.L): BCG Matrix |
Fully Editable: Tailor To Your Needs In Excel Or Sheets
Professional Design: Trusted, Industry-Standard Templates
Investor-Approved Valuation Models
MAC/PC Compatible, Fully Unlocked
No Expertise Is Needed; Easy To Follow
Glencore plc (GLEN.L) Bundle
Glencore plc stands at the forefront of the global commodities market, navigating a complex landscape shaped by its diverse portfolio. By applying the Boston Consulting Group Matrix, we uncover the dynamics of its operations, highlighting which segments shine as stars, which bring in steady cash, which struggle in the shadows, and which hold potential for growth. Dive in to discover how Glencore's strategic positioning influences its market performance and future prospects.
Background of Glencore plc
Glencore plc, established in 1974, is a multinational commodity trading and mining company headquartered in Baar, Switzerland. Initially focused on trading commodities, Glencore has evolved into one of the world's largest producers and marketers of natural resources, including metals, minerals, and energy.
As of October 2023, Glencore operates across various segments, including copper, zinc, nickel, and thermal and metallurgical coal. The company's operations span over 35 countries, employing around 160,000 people globally. In 2022, Glencore reported revenue of approximately $254 billion, reflecting its expansive reach and strong market position.
Glencore's vertically integrated business model links production and marketing, allowing it to control the entire supply chain—from extraction to sales. The company is a significant player in the global commodities market and is listed on the London Stock Exchange under the ticker symbol GLEN.
In recent years, Glencore has faced scrutiny regarding its environmental practices and governance. However, it continues to adapt by implementing sustainability initiatives aimed at reducing carbon emissions and promoting responsible mining practices. As of 2023, Glencore has committed to achieving net-zero operational emissions by 2050.
With a strong focus on strategic acquisitions, Glencore has expanded its asset portfolio significantly. The full impact of such strategies is reflected in its financial performance, as it maintains a solid balance sheet with an EBITDA margin that ranges from 15% to 20% in recent years.
Overall, Glencore represents a dynamic and complex entity in the commodities sector, balancing growth ambitions with environmental responsibilities.
Glencore plc - BCG Matrix: Stars
Glencore plc, one of the world's largest diversified natural resource companies, operates in various sectors, with significant contributions from its copper mining operations, cobalt production, and renewable energy initiatives. These segments represent the company's Stars, characterized by high market share and robust growth potential.
Copper Mining in Africa
As of 2022, Glencore’s copper production reached approximately 1.1 million metric tons, making it one of the largest producers globally. The company’s operations in the Democratic Republic of Congo (DRC) and Zambia are particularly noteworthy.
In the DRC, Glencore operates the Katanga Mining project, which has been instrumental in boosting its market share. In 2022, Katanga produced around 300,000 metric tons of copper cathodes. The strong demand for copper, driven by its essential role in electric vehicle (EV) manufacturing and renewable energy technologies, has resulted in a growth forecast of 3.7% CAGR in the global copper market from 2022 to 2027.
| Year | Copper Production (metric tons) | Average Copper Price (USD per metric ton) | Revenue from Copper (USD Billion) |
|---|---|---|---|
| 2020 | 1.3 million | 6,000 | 7.8 |
| 2021 | 1.5 million | 8,900 | 13.3 |
| 2022 | 1.1 million | 8,100 | 8.9 |
Cobalt Production
Glencore is a leading supplier of cobalt, with production primarily sourced from its DRC operations. In 2022, cobalt production was reported to be around 30,000 metric tons. The global cobalt market is expected to grow substantially, with demand projected to increase due to the growing EV sector.
The market price for cobalt soared to approximately $35,000 per metric ton in mid-2022 as demand surged. According to industry forecasts, cobalt pricing is anticipated to stabilize around $25,000 to $30,000 per metric ton over the next five years, driven by consistent demand from battery manufacturers.
| Year | Cobalt Production (metric tons) | Average Cobalt Price (USD per metric ton) | Revenue from Cobalt (USD Billion) |
|---|---|---|---|
| 2020 | 33,000 | 28,000 | 0.9 |
| 2021 | 32,000 | 40,000 | 1.3 |
| 2022 | 30,000 | 35,000 | 1.05 |
Renewable Energy Initiatives
Glencore is actively investing in renewable energy projects, recognizing the transition towards sustainable practices. In 2022, the company allocated $1.5 billion towards renewable initiatives, focusing on solar and wind energy projects. This strategic move positions Glencore to benefit from the growing clean energy market, expected to reach a valuation of $2 trillion by 2030.
Moreover, Glencore's investment in battery recycling technologies is projected to generate significant revenue streams, as the demand for lithium-ion batteries grows. The anticipated growth rate of the global battery recycling market is expected to be around 20.0% CAGR from 2022 to 2030.
| Year | Renewable Energy Investment (USD Billion) | Projected Market Growth (USD Trillion) | Annual Growth Rate (CAGR %) |
|---|---|---|---|
| 2020 | 1.0 | 1.2 | 15.0 |
| 2021 | 1.2 | 1.5 | 18.0 |
| 2022 | 1.5 | 2.0 | 20.0 |
Glencore plc - BCG Matrix: Cash Cows
Glencore plc has several operations classified as cash cows within its business portfolio, particularly in its coal mining operations, oil trading division, and ferroalloys production. These segments exhibit high market share in mature markets, contributing significantly to the company's cash flow.
Coal Mining Operations
Glencore's coal mining operations are a standout cash cow, particularly in thermal and metallurgical coal. In 2022, the coal segment recorded revenues of approximately $24.6 billion, driven by a high demand for energy amidst global supply challenges. The operating profit margin for this segment was around 40%, highlighting its capability to generate significant cash flows.
Moreover, Glencore produced about 99 million tonnes of coal in 2022, with the majority coming from its Australian operations. This production level solidifies its position as one of the top coal producers globally.
Oil Trading Division
The oil trading division of Glencore has also emerged as a highly profitable cash cow. In 2022, the division reported revenues of approximately $147 billion with an operating profit margin of about 2.3%. Glencore's extensive network allows it to optimize trading strategies while mitigating risks associated with price volatility.
The company traded around 5.4 million barrels per day in 2022, marking it as a significant player in the global oil market. The division generates substantial cash flows that support the broader operations and strategic initiatives of Glencore.
Ferroalloys Production
Ferroalloys represent another crucial cash cow for Glencore. In 2022, the revenue from ferroalloys production reached approximately $6.3 billion, backed by strong demand in the stainless steel sector. The operating profit margin for this segment was around 22%.
In terms of production, Glencore managed to produce 1.5 million tonnes of ferroalloys in 2022. The company's strategic investments in improving efficiencies and production processes have allowed it to maintain a solid market share even in a low-growth environment.
| Segment | 2022 Revenue (in billions) | Operating Profit Margin (%) | Production (in tonnes or barrels) |
|---|---|---|---|
| Coal Mining Operations | $24.6 | 40% | 99 million |
| Oil Trading Division | $147 | 2.3% | 5.4 million barrels per day |
| Ferroalloys Production | $6.3 | 22% | 1.5 million |
These cash cow segments play a vital role in providing the necessary funds for Glencore to invest in other areas of its business, ensuring ongoing operational success and shareholder returns.
Glencore plc - BCG Matrix: Dogs
Glencore plc, a diversified natural resources company, has several business lines that can be classified as 'Dogs' in the BCG Matrix, indicating their positioning in low-growth markets with low market share. This segment includes zinc production in mature markets, nickel operations in declining markets, and minor agricultural commodities.
Zinc Production in Mature Markets
Glencore's zinc operations are primarily located in mature markets, such as Australia and Europe. In 2022, the company produced approximately 1.1 million metric tons of zinc. However, the global zinc market has seen limited growth, with an annual growth rate of just 2% from 2019 to 2023. The price of zinc averaged around $3,600 per metric ton in 2022, but this has become less lucrative due to increased competition and market saturation.
| Year | Zinc Production (Metric Tons) | Average Price (USD per Metric Ton) | Global Market Growth Rate (%) |
|---|---|---|---|
| 2020 | 1,200,000 | $2,800 | 1.5 |
| 2021 | 1,150,000 | $3,200 | 1.8 |
| 2022 | 1,100,000 | $3,600 | 2.0 |
| 2023 (Projected) | 1,100,000 | $3,750 | 2.1 |
Given the stagnant growth and declining revenues, the zinc segment poses a challenge for Glencore, making it a prime candidate for divestiture or restructuring.
Nickel Operations in Declining Markets
Glencore's nickel operations have also struggled, particularly in regions like Canada and Australia. In 2022, they reported nickel production of 17,800 metric tons, with an average market price of $20,000 per metric ton. The global nickel market has been characterized by declining demand, primarily due to reduced usage in traditional sectors, resulting in an estimated annual decline in market size of 3% since 2020.
| Year | Nickel Production (Metric Tons) | Average Price (USD per Metric Ton) | Global Market Decline Rate (%) |
|---|---|---|---|
| 2020 | 20,000 | $15,000 | -2 |
| 2021 | 18,500 | $18,000 | -1 |
| 2022 | 17,800 | $20,000 | -3 |
| 2023 (Projected) | 17,000 | $19,500 | -3 |
This declining market presents a significant challenge for Glencore, especially given that the nickel segment requires substantial capital investment but yields limited returns.
Minor Agricultural Commodities
Glencore's involvement in agricultural commodities tends to focus on minor products, which contribute a small percentage of the company's overall revenue. In 2022, the agricultural division generated around $6.4 billion, but with a diminishing market share, this segment has been classified as a dog due to its inconsistent performance in low-demand environments. The market growth for these commodities in regions such as North America has been flat with an annual growth rate close to 1%.
| Year | Agricultural Revenue (USD Billion) | Market Growth Rate (%) | Contribution to Total Revenue (%) |
|---|---|---|---|
| 2020 | 5.8 | 0.5 | 15 |
| 2021 | 6.2 | 1 | 16 |
| 2022 | 6.4 | 1 | 15 |
| 2023 (Projected) | 6.5 | 0.7 | 14 |
Overall, the agricultural segment's low growth and market share issues further enforce its classification as a 'Dog' within Glencore's portfolio. The financial performance of these operations indicates a need for reassessment in terms of resource allocation and strategic planning.
Glencore plc - BCG Matrix: Question Marks
Within Glencore plc's portfolio, several ventures identify as Question Marks, navigating a landscape characterized by high growth potential yet limited market share. These units require strategic analysis and investment to transform into Stars or, alternatively, a decision to divest if prospects remain bleak.
Lithium Exploration Projects
Glencore is actively involved in lithium exploration, aiming to capitalize on the surging demand for electric vehicle (EV) batteries. As of 2023, the global lithium market is projected to reach approximately $8.5 billion by 2027, growing at a compound annual growth rate (CAGR) of about 12%.
In its recent exploration endeavors, Glencore has reported significant lithium resources in regions such as the Democratic Republic of the Congo (DRC). In 2023, their lithium exploration projects have an estimated resource base of around 500,000 tons of lithium oxide equivalent. However, current production capabilities remain nascent, translating to a low market share in this burgeoning market.
Aluminum Operations
Glencore's aluminum segment has shown promising growth, particularly in the context of global market dynamics. The aluminum market size was valued at approximately $158.02 billion in 2022 and is projected to expand at a CAGR of 5% from 2023 to 2030. Despite this growth, Glencore's share remains relatively modest compared to major competitors like Rio Tinto and Alcoa.
As of 2023, Glencore's aluminum production stands at around 1.4 million tons annually, translating to a market share of approximately 8%. The company’s strategy focuses on enhancing production efficiencies and exploring collaborative ventures to tap into wider markets. However, the high energy costs and the competitive landscape pose challenges, prolonging the transformation of these operations from Question Marks to Stars.
Emerging Market Commodity Trading
Glencore's commodity trading operations in emerging markets present another avenue classified as Question Marks. The emerging markets, particularly in Asia and Africa, are projected to dominate global commodity consumption, with projected growth of around 7% annually through 2025.
In 2022, Glencore reported revenues of approximately $20 billion from its trading activities in these regions. However, with a market share estimated at only 5%, these operations consume significant resources relative to their returns. The firm aims to boost market penetration through strategic partnerships and leveraging local expertise to navigate these high-growth sectors.
| Segment | Market Value (2023) | Estimated CAGR | Glencore Production/Revenue | Market Share |
|---|---|---|---|---|
| Lithium Exploration | $8.5 billion | 12% | 500,000 tons | Low |
| Aluminum Operations | $158.02 billion | 5% | 1.4 million tons | 8% |
| Emerging Market Commodity Trading | $20 billion | 7% | $20 billion | 5% |
Glencore's approach to these Question Marks necessitates significant investment to bolster market share or the alternative of divesting from underperforming assets. The company's strategic focus will determine whether these ventures can evolve into more robust contributors to revenue in the long term.
The BCG Matrix offers a clear lens through which to view Glencore plc's diverse portfolio, highlighting its strengths in copper and cobalt while also identifying areas like zinc and nickel that require strategic reevaluation. As the company navigates the evolving commodity landscape, understanding these classifications will be crucial for investors and stakeholders alike in making informed decisions.
[right_small]Disclaimer
All information, articles, and product details provided on this website are for general informational and educational purposes only. We do not claim any ownership over, nor do we intend to infringe upon, any trademarks, copyrights, logos, brand names, or other intellectual property mentioned or depicted on this site. Such intellectual property remains the property of its respective owners, and any references here are made solely for identification or informational purposes, without implying any affiliation, endorsement, or partnership.
We make no representations or warranties, express or implied, regarding the accuracy, completeness, or suitability of any content or products presented. Nothing on this website should be construed as legal, tax, investment, financial, medical, or other professional advice. In addition, no part of this site—including articles or product references—constitutes a solicitation, recommendation, endorsement, advertisement, or offer to buy or sell any securities, franchises, or other financial instruments, particularly in jurisdictions where such activity would be unlawful.
All content is of a general nature and may not address the specific circumstances of any individual or entity. It is not a substitute for professional advice or services. Any actions you take based on the information provided here are strictly at your own risk. You accept full responsibility for any decisions or outcomes arising from your use of this website and agree to release us from any liability in connection with your use of, or reliance upon, the content or products found herein.