
|
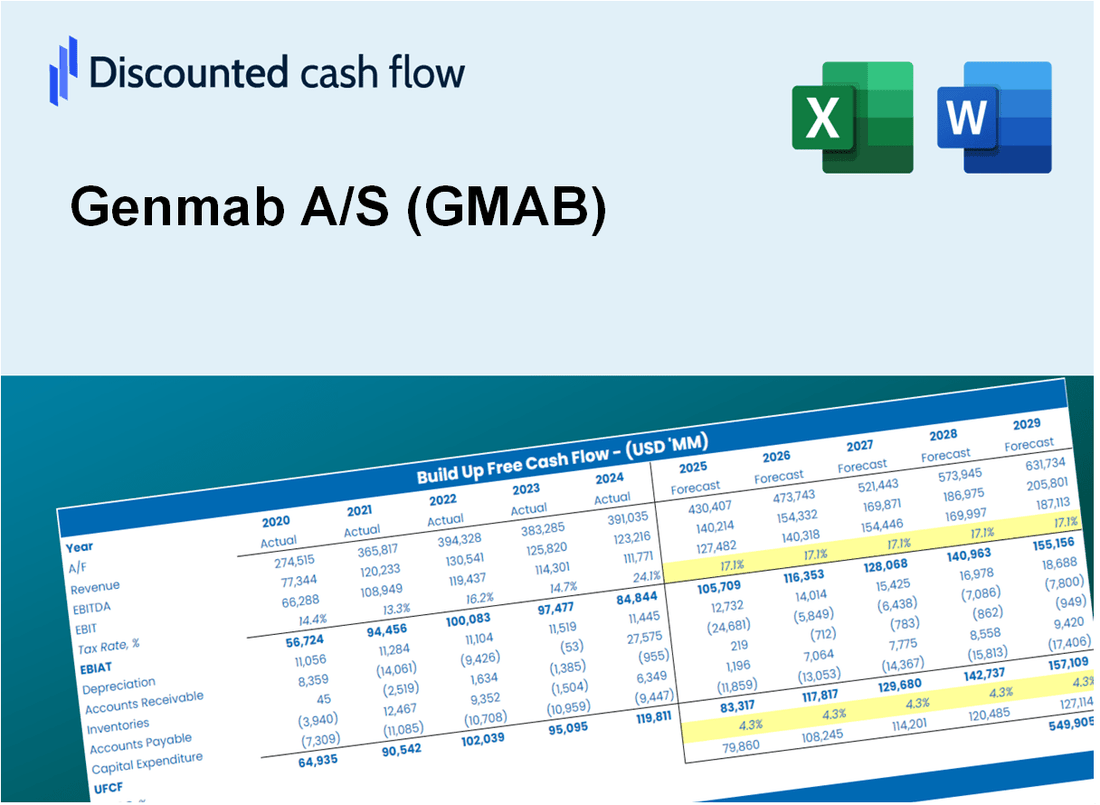
Genmab A/S (GMAB) DCF Valuation |
Fully Editable: Tailor To Your Needs In Excel Or Sheets
Professional Design: Trusted, Industry-Standard Templates
Investor-Approved Valuation Models
MAC/PC Compatible, Fully Unlocked
No Expertise Is Needed; Easy To Follow
Genmab A/S (GMAB) Bundle
Looking to evaluate the intrinsic value of Genmab A/S? Our (GMAB) DCF Calculator integrates real-world data with extensive customization features, allowing you to refine your forecasts and enhance your investment strategies.
What You Will Get
- Editable Forecast Inputs: Easily modify assumptions (growth %, margins, WACC) to generate various scenarios.
- Real-World Data: Genmab A/S’s financial data pre-filled to kickstart your analysis.
- Automatic DCF Outputs: The template computes Net Present Value (NPV) and intrinsic value automatically for you.
- Customizable and Professional: A sleek Excel model that adjusts to your valuation requirements.
- Built for Analysts and Investors: Perfect for evaluating projections, confirming strategies, and streamlining your workflow.
Key Features
- Customizable Research Parameters: Adjust essential metrics such as drug development timelines, clinical trial costs, and expected market penetration.
- Instant Valuation Calculations: Provides immediate insights into intrinsic value, NPV, and other financial metrics.
- High-Precision Accuracy: Leverages Genmab’s actual financial data for reliable valuation results.
- Effortless Scenario Analysis: Easily evaluate various hypotheses and analyze different outcomes.
- Efficiency Booster: Removes the necessity of constructing intricate valuation models from the ground up.
How It Works
- Step 1: Download the Excel file.
- Step 2: Review Genmab A/S’s pre-filled financial data and forecasts.
- Step 3: Modify critical inputs such as revenue growth, WACC, and tax rates (highlighted cells).
- Step 4: Watch the DCF model update instantly as you adjust your assumptions.
- Step 5: Analyze the outputs and leverage the results for investment decisions.
Why Choose Genmab A/S (GMAB)?
- Innovative Solutions: Cutting-edge therapies that address unmet medical needs.
- Strong Pipeline: A diverse range of products in various stages of development enhances growth potential.
- Expert Team: Led by industry leaders with extensive experience in biopharmaceuticals.
- Commitment to Quality: Rigorous standards ensure the highest level of product integrity.
- Proven Track Record: Recognized for successful collaborations and partnerships in the biotech sector.
Who Should Use This Product?
- Investors: Accurately estimate Genmab A/S’s fair value before making investment decisions.
- CFOs: Leverage a professional-grade DCF model for financial reporting and analysis specific to Genmab A/S (GMAB).
- Consultants: Quickly adapt the template for valuation reports tailored to Genmab A/S (GMAB) clients.
- Entrepreneurs: Gain insights into financial modeling practices employed by leading biotech firms like Genmab A/S (GMAB).
- Educators: Use it as a teaching tool to illustrate valuation methodologies relevant to the biotech industry.
What the Template Contains
- Pre-Filled DCF Model: Genmab A/S’s financial data preloaded for immediate use.
- WACC Calculator: Detailed calculations for Weighted Average Cost of Capital.
- Financial Ratios: Evaluate Genmab A/S’s profitability, leverage, and efficiency.
- Editable Inputs: Change assumptions such as growth, margins, and CAPEX to fit your scenarios.
- Financial Statements: Annual and quarterly reports to support detailed analysis.
- Interactive Dashboard: Easily visualize key valuation metrics and results.
Disclaimer
All information, articles, and product details provided on this website are for general informational and educational purposes only. We do not claim any ownership over, nor do we intend to infringe upon, any trademarks, copyrights, logos, brand names, or other intellectual property mentioned or depicted on this site. Such intellectual property remains the property of its respective owners, and any references here are made solely for identification or informational purposes, without implying any affiliation, endorsement, or partnership.
We make no representations or warranties, express or implied, regarding the accuracy, completeness, or suitability of any content or products presented. Nothing on this website should be construed as legal, tax, investment, financial, medical, or other professional advice. In addition, no part of this site—including articles or product references—constitutes a solicitation, recommendation, endorsement, advertisement, or offer to buy or sell any securities, franchises, or other financial instruments, particularly in jurisdictions where such activity would be unlawful.
All content is of a general nature and may not address the specific circumstances of any individual or entity. It is not a substitute for professional advice or services. Any actions you take based on the information provided here are strictly at your own risk. You accept full responsibility for any decisions or outcomes arising from your use of this website and agree to release us from any liability in connection with your use of, or reliance upon, the content or products found herein.