
|
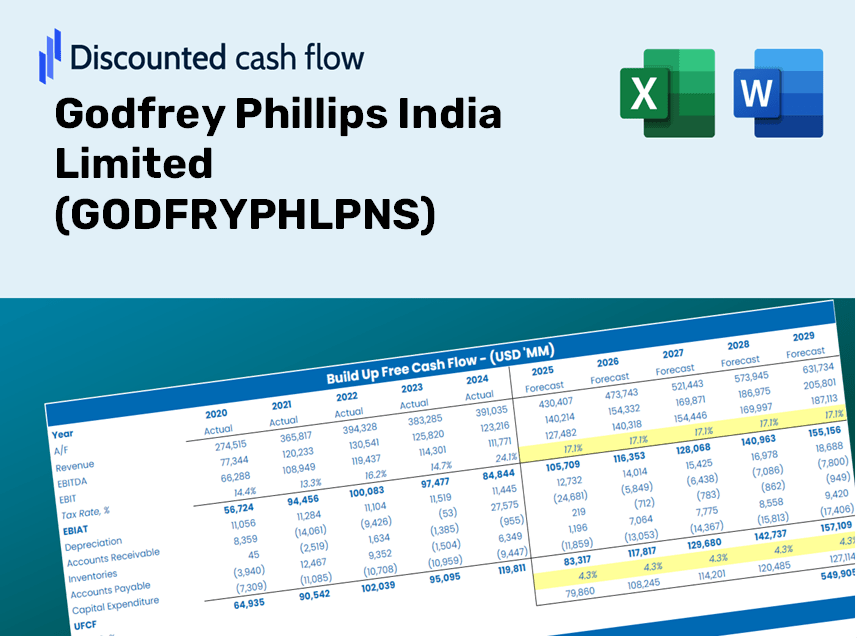
Godfrey Phillips India Limited (GODFRYPHLP.NS) DCF Valuation |
Fully Editable: Tailor To Your Needs In Excel Or Sheets
Professional Design: Trusted, Industry-Standard Templates
Investor-Approved Valuation Models
MAC/PC Compatible, Fully Unlocked
No Expertise Is Needed; Easy To Follow
Godfrey Phillips India Limited (GODFRYPHLP.NS) Bundle
Evaluate the financial outlook of Godfrey Phillips India Limited (GODFRYPHLPNS) like an expert! This (GODFRYPHLPNS) DCF Calculator provides pre-filled financial data and the flexibility to modify revenue growth, WACC, margins, and other essential assumptions to align with your projections.
What You Will Receive
- Authentic GODFRYPHLPNS Financial Data: Pre-loaded with historical and projected figures for accurate analysis of Godfrey Phillips India Limited.
- Completely Customizable Template: Easily adjust essential inputs such as revenue growth, WACC, and EBITDA percentages.
- Instantaneous Calculations: Watch the intrinsic value of GODFRYPHLPNS update in real-time as you make adjustments.
- Professional Valuation Instrument: Crafted for investors, analysts, and consultants looking for precise DCF outcomes.
- Intuitive User Interface: Well-organized layout and straightforward instructions suitable for users of all experience levels.
Key Features of Godfrey Phillips India Limited (GODFRYPHLPNS)
- Comprehensive Financial Data: Gain access to precise pre-loaded historical figures and forecasts for the future.
- Adjustable Forecast Parameters: Modify highlighted fields such as WACC, growth rates, and profit margins.
- Automated Calculations: Benefit from real-time updates to DCF, Net Present Value (NPV), and cash flow assessments.
- Insightful Visual Dashboard: Utilize clear charts and summaries to effectively represent your valuation outcomes.
- Designed for All Experience Levels: A user-friendly layout tailored for investors, CFOs, and consultants alike.
How It Functions
- Download: Obtain the pre-formatted Excel file featuring Godfrey Phillips India Limited’s (GODFRYPHLPNS) financial data.
- Customize: Tailor your projections, including revenue growth, EBITDA %, and WACC as needed.
- Update Instantly: The intrinsic value and NPV calculations refresh in real-time.
- Explore Scenarios: Generate various projections and compare results on the spot.
- Make Informed Decisions: Leverage the valuation outputs to shape your investment approach.
Why Opt for Godfrey Phillips India Limited's Calculator?
- Precision: Accurate financial data sourced directly from Godfrey Phillips ensures reliable results.
- Adaptability: Crafted to allow users to easily modify and test different inputs.
- Efficiency: Eliminate the tedious process of creating a DCF model from the ground up.
- Expert Quality: Built with the precision and usability that cater to CFO-level standards.
- Intuitive Design: Simple to navigate, making it accessible for users without extensive financial modeling skills.
Who Can Benefit from Our Product?
- Finance Students: Acquire valuation skills and practice with real-world data.
- Researchers: Integrate industry-standard models into studies or academic projects.
- Investors: Validate your hypotheses and evaluate the valuation processes for Godfrey Phillips India Limited (GODFRYPHLPNS).
- Financial Analysts: Enhance your efficiency with a customizable, ready-to-use DCF model.
- Entrepreneurs: Understand the analytical methods used for assessing large public companies like Godfrey Phillips India Limited (GODFRYPHLPNS).
Contents of the Template
- Pre-Filled DCF Model: Godfrey Phillips India's financial data preloaded for immediate analysis.
- WACC Calculator: Comprehensive calculations for the Weighted Average Cost of Capital.
- Financial Ratios: Assess Godfrey Phillips India's profitability, leverage, and efficiency.
- Editable Inputs: Modify assumptions like growth, margins, and CAPEX to suit your scenarios.
- Financial Statements: Annual and quarterly reports for in-depth analysis support.
- Interactive Dashboard: Easily visualize essential valuation metrics and outcomes.
Disclaimer
All information, articles, and product details provided on this website are for general informational and educational purposes only. We do not claim any ownership over, nor do we intend to infringe upon, any trademarks, copyrights, logos, brand names, or other intellectual property mentioned or depicted on this site. Such intellectual property remains the property of its respective owners, and any references here are made solely for identification or informational purposes, without implying any affiliation, endorsement, or partnership.
We make no representations or warranties, express or implied, regarding the accuracy, completeness, or suitability of any content or products presented. Nothing on this website should be construed as legal, tax, investment, financial, medical, or other professional advice. In addition, no part of this site—including articles or product references—constitutes a solicitation, recommendation, endorsement, advertisement, or offer to buy or sell any securities, franchises, or other financial instruments, particularly in jurisdictions where such activity would be unlawful.
All content is of a general nature and may not address the specific circumstances of any individual or entity. It is not a substitute for professional advice or services. Any actions you take based on the information provided here are strictly at your own risk. You accept full responsibility for any decisions or outcomes arising from your use of this website and agree to release us from any liability in connection with your use of, or reliance upon, the content or products found herein.