
|
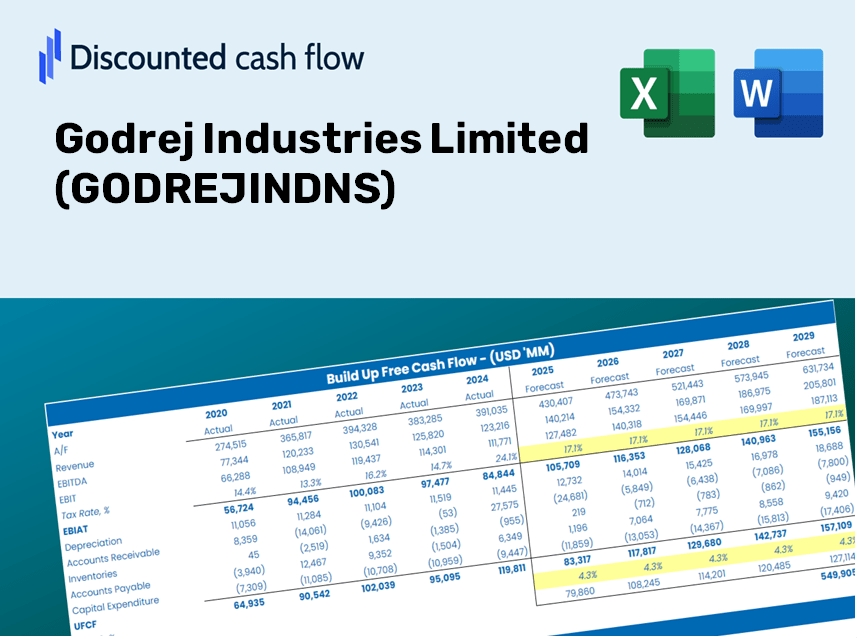
Godrej Industries Limited (GODREJIND.NS) DCF Valuation |
Fully Editable: Tailor To Your Needs In Excel Or Sheets
Professional Design: Trusted, Industry-Standard Templates
Investor-Approved Valuation Models
MAC/PC Compatible, Fully Unlocked
No Expertise Is Needed; Easy To Follow
Godrej Industries Limited (GODREJIND.NS) Bundle
Looking to calculate the intrinsic value of Godrej Industries Limited? Our (GODREJINDNS) DCF Calculator integrates real-world data with extensive customization features, enabling you to adjust forecasts and enhance your investment choices.
Discounted Cash Flow (DCF) - (USD MM)
| Year | AY1 2021 |
AY2 2022 |
AY3 2023 |
AY4 2024 |
AY5 2025 |
FY1 2026 |
FY2 2027 |
FY3 2028 |
FY4 2029 |
FY5 2030 |
|---|---|---|---|---|---|---|---|---|---|---|
| Revenue | 99,792.3 | 149,996.2 | 176,809.9 | 175,885.3 | 209,832.4 | 255,451.2 | 310,987.9 | 378,598.5 | 460,908.1 | 561,112.3 |
| Revenue Growth, % | 0 | 50.31 | 17.88 | -0.52293 | 19.3 | 21.74 | 21.74 | 21.74 | 21.74 | 21.74 |
| EBITDA | 9,624.8 | 18,902.4 | 24,125.3 | 21,792.5 | 33,708.9 | 32,874.7 | 40,021.9 | 48,722.9 | 59,315.5 | 72,211.1 |
| EBITDA, % | 9.64 | 12.6 | 13.64 | 12.39 | 16.06 | 12.87 | 12.87 | 12.87 | 12.87 | 12.87 |
| Depreciation | 2,423.4 | 2,329.3 | 2,603.9 | 3,111.7 | 3,653.9 | 4,580.0 | 5,575.7 | 6,787.9 | 8,263.7 | 10,060.3 |
| Depreciation, % | 2.43 | 1.55 | 1.47 | 1.77 | 1.74 | 1.79 | 1.79 | 1.79 | 1.79 | 1.79 |
| EBIT | 7,201.4 | 16,573.1 | 21,521.4 | 18,680.8 | 30,055.0 | 28,294.7 | 34,446.1 | 41,934.9 | 51,051.8 | 62,150.8 |
| EBIT, % | 7.22 | 11.05 | 12.17 | 10.62 | 14.32 | 11.08 | 11.08 | 11.08 | 11.08 | 11.08 |
| Total Cash | 58,195.8 | 59,355.1 | 45,740.1 | 61,554.6 | 117,241.3 | 109,654.2 | 133,493.7 | 162,516.0 | 197,848.0 | 240,861.3 |
| Total Cash, percent | .0 | .0 | .0 | .0 | .0 | .0 | .0 | .0 | .0 | .0 |
| Account Receivables | 15,542.7 | 18,673.5 | 59,412.2 | 69,189.4 | 62,291.0 | 66,749.7 | 81,261.5 | 98,928.2 | 120,435.8 | 146,619.2 |
| Account Receivables, % | 15.58 | 12.45 | 33.6 | 39.34 | 29.69 | 26.13 | 26.13 | 26.13 | 26.13 | 26.13 |
| Inventories | 62,489.7 | 77,965.7 | 143,161.8 | 251,808.8 | 347,876.1 | 202,096.4 | 246,033.4 | 299,522.6 | 364,640.6 | 443,915.6 |
| Inventories, % | 62.62 | 51.98 | 80.97 | 143.17 | 165.79 | 79.11 | 79.11 | 79.11 | 79.11 | 79.11 |
| Accounts Payable | 34,041.2 | 37,290.2 | 48,688.1 | 49,889.9 | 52,346.6 | 71,435.2 | 86,965.7 | 105,872.6 | 128,889.9 | 156,911.3 |
| Accounts Payable, % | 34.11 | 24.86 | 27.54 | 28.37 | 24.95 | 27.96 | 27.96 | 27.96 | 27.96 | 27.96 |
| Capital Expenditure | -7,370.3 | -5,238.5 | -8,276.8 | -11,974.9 | -7,808.4 | -13,328.9 | -16,226.6 | -19,754.4 | -24,049.1 | -29,277.6 |
| Capital Expenditure, % | -7.39 | -3.49 | -4.68 | -6.81 | -3.72 | -5.22 | -5.22 | -5.22 | -5.22 | -5.22 |
| Tax Rate, % | 58.3 | 58.3 | 58.3 | 58.3 | 58.3 | 58.3 | 58.3 | 58.3 | 58.3 | 58.3 |
| EBITAT | 3,912.5 | 8,448.7 | 12,483.0 | 1,161.6 | 12,534.4 | 11,953.6 | 14,552.3 | 17,716.1 | 21,567.7 | 26,256.7 |
| Depreciation | ||||||||||
| Changes in Account Receivables | ||||||||||
| Changes in Inventories | ||||||||||
| Changes in Accounts Payable | ||||||||||
| Capital Expenditure | ||||||||||
| UFCF | -45,025.6 | -9,818.3 | -87,726.8 | -124,924.0 | -78,332.3 | 163,614.4 | -39,016.9 | -47,499.4 | -57,826.0 | -70,397.7 |
| WACC, % | 5.27 | 5.1 | 5.45 | 2.87 | 4.64 | 4.67 | 4.67 | 4.67 | 4.67 | 4.67 |
| PV UFCF | ||||||||||
| SUM PV UFCF | -24,939.0 | |||||||||
| Long Term Growth Rate, % | 4.00 | |||||||||
| Free cash flow (T + 1) | -73,214 | |||||||||
| Terminal Value | -10,959,339 | |||||||||
| Present Terminal Value | -8,723,961 | |||||||||
| Enterprise Value | -8,748,900 | |||||||||
| Net Debt | 352,452 | |||||||||
| Equity Value | -9,101,352 | |||||||||
| Diluted Shares Outstanding, MM | 337 | |||||||||
| Equity Value Per Share | -27,018.84 |
What You Will Receive
- Flexible Forecast Inputs: Effortlessly adjust assumptions (growth %, profit margins, WACC) to generate various scenarios.
- Pre-filled Real Data: Godrej Industries Limited’s financial information is included to kickstart your analysis.
- Automated DCF Outputs: The template automatically computes Net Present Value (NPV) and intrinsic value for you.
- Customizable and Professional Design: A refined Excel model that can be tailored to your valuation requirements.
- Designed for Analysts and Investors: Perfect for evaluating projections, confirming strategies, and enhancing efficiency.
Key Features
- Customizable Financial Inputs: Adjust essential parameters such as revenue growth, EBITDA margin, and capital expenses.
- Instant DCF Valuation: Quickly computes intrinsic value, NPV, and various financial metrics.
- High-Precision Accuracy: Leverages Godrej Industries Limited’s (GODREJINDNS) actual financial data for credible valuation results.
- Simplified Scenario Analysis: Easily evaluate different assumptions and analyze outcomes with clarity.
- Efficiency Boosting Tool: Avoid the hassle of constructing intricate valuation models from the ground up.
How It Functions
- Download the Template: Gain immediate access to the Excel-based GODREJINDNS DCF Calculator.
- Input Your Assumptions: Modify the yellow-highlighted cells for growth rates, WACC, margins, and more.
- Instant Calculations: The model automatically recalculates Godrej Industries Limited’s intrinsic value.
- Test Scenarios: Explore various assumptions to assess potential changes in valuation.
- Analyze and Decide: Utilize the outcomes to inform your investment or financial analysis.
Why Choose This Calculator for Godrej Industries Limited (GODREJINDNS)?
- User-Friendly Interface: Built for both newcomers and seasoned professionals.
- Customizable Inputs: Adjust parameters easily to tailor your analysis.
- Real-Time Updates: Witness immediate changes to Godrej's valuation as you tweak inputs.
- Preloaded Data: Comes with Godrej's latest financial information for swift evaluations.
- Industry Approved: Favored by investors and analysts for making well-informed choices.
Who Should Use This Product?
- Individual Investors: Make informed decisions regarding the acquisition or sale of Godrej Industries Limited (GODREJINDNS) stock.
- Financial Analysts: Enhance valuation processes with accessible financial models tailored for Godrej Industries Limited (GODREJINDNS).
- Consultants: Provide clients with accurate and timely valuation insights related to Godrej Industries Limited (GODREJINDNS).
- Business Owners: Gain insights into how major corporations like Godrej Industries Limited (GODREJINDNS) are valued to inform your own business strategies.
- Finance Students: Explore valuation methodologies using real-life data and case studies centered on Godrej Industries Limited (GODREJINDNS).
Contents of the Template
- Pre-Filled DCF Model: Godrej Industries Limited’s financial data preloaded for immediate analysis.
- WACC Calculator: Comprehensive calculations for the Weighted Average Cost of Capital.
- Financial Ratios: Assess Godrej Industries Limited’s profitability, leverage, and operational efficiency.
- Editable Inputs: Modify assumptions like growth rates, profit margins, and capital expenditures to align with your scenarios.
- Financial Statements: Access annual and quarterly reports for in-depth analysis.
- Interactive Dashboard: Effortlessly visualize essential valuation metrics and outcomes.
Disclaimer
All information, articles, and product details provided on this website are for general informational and educational purposes only. We do not claim any ownership over, nor do we intend to infringe upon, any trademarks, copyrights, logos, brand names, or other intellectual property mentioned or depicted on this site. Such intellectual property remains the property of its respective owners, and any references here are made solely for identification or informational purposes, without implying any affiliation, endorsement, or partnership.
We make no representations or warranties, express or implied, regarding the accuracy, completeness, or suitability of any content or products presented. Nothing on this website should be construed as legal, tax, investment, financial, medical, or other professional advice. In addition, no part of this site—including articles or product references—constitutes a solicitation, recommendation, endorsement, advertisement, or offer to buy or sell any securities, franchises, or other financial instruments, particularly in jurisdictions where such activity would be unlawful.
All content is of a general nature and may not address the specific circumstances of any individual or entity. It is not a substitute for professional advice or services. Any actions you take based on the information provided here are strictly at your own risk. You accept full responsibility for any decisions or outcomes arising from your use of this website and agree to release us from any liability in connection with your use of, or reliance upon, the content or products found herein.