
|
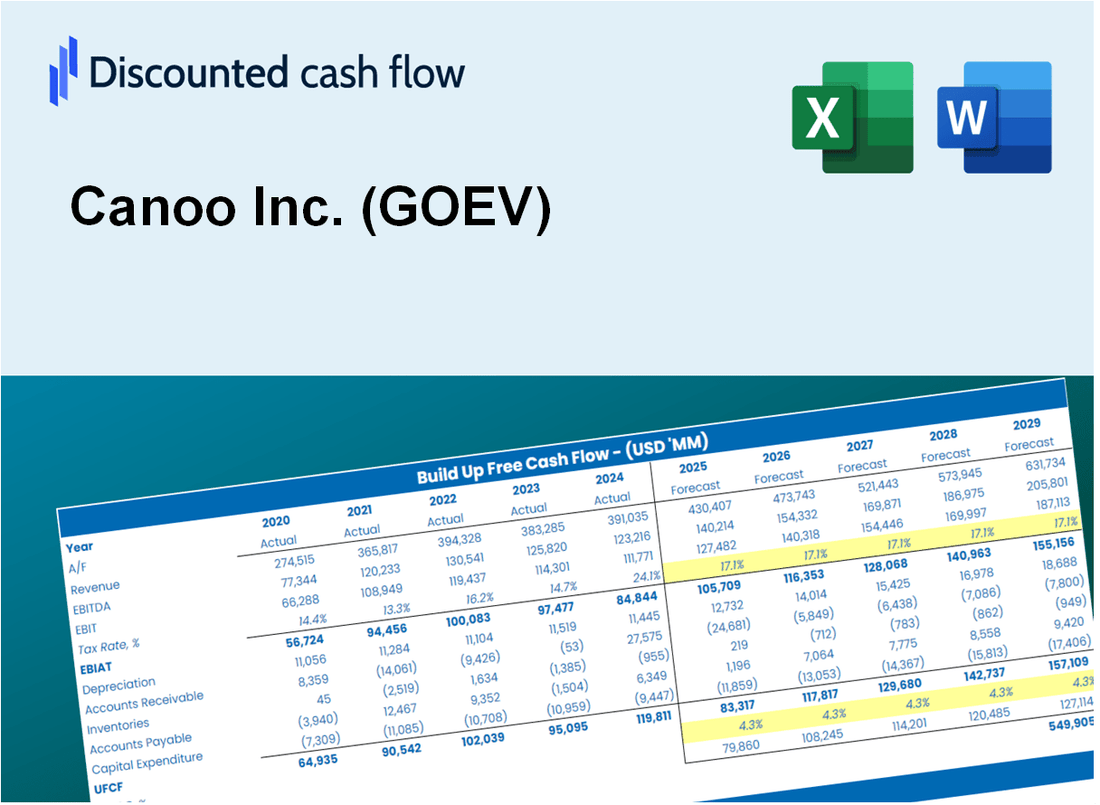
Canoo Inc. (GOEV) DCF Valuation |
Fully Editable: Tailor To Your Needs In Excel Or Sheets
Professional Design: Trusted, Industry-Standard Templates
Investor-Approved Valuation Models
MAC/PC Compatible, Fully Unlocked
No Expertise Is Needed; Easy To Follow
Canoo Inc. (GOEV) Bundle
Explore Canoo Inc.'s (GOEV) financial outlook with our user-friendly DCF Calculator! Enter your projections for growth, margins, and expenses to calculate Canoo Inc.'s (GOEV) intrinsic value and enhance your investment approach.
What You Will Get
- Real Canoo Data: Preloaded financials – from revenue to EBIT – based on actual and projected figures for Canoo Inc. (GOEV).
- Full Customization: Adjust all critical parameters (yellow cells) like WACC, growth %, and tax rates to fit your analysis.
- Instant Valuation Updates: Automatic recalculations to analyze the impact of changes on Canoo Inc.'s (GOEV) fair value.
- Versatile Excel Template: Designed for quick edits, scenario testing, and detailed projections specific to Canoo Inc. (GOEV).
- Time-Saving and Accurate: Avoid building models from scratch while ensuring precision and flexibility in your financial analysis.
Key Features
- Real-Life GOEV Data: Pre-filled with Canoo Inc.'s historical financials and future projections.
- Fully Customizable Inputs: Modify revenue growth, margins, WACC, tax rates, and capital expenditures to fit your analysis.
- Dynamic Valuation Model: Automatic recalculations of Net Present Value (NPV) and intrinsic value based on your adjustments.
- Scenario Testing: Develop various forecast scenarios to explore different valuation possibilities.
- User-Friendly Design: Intuitive, organized, and crafted for both professionals and newcomers.
How It Works
- Download: Obtain the pre-formatted Excel file containing Canoo Inc.'s (GOEV) financial information.
- Customize: Tailor your forecasts, including revenue growth, EBITDA %, and WACC as needed.
- Update Automatically: The intrinsic value and NPV calculations refresh in real-time.
- Test Scenarios: Generate various projections and analyze results immediately.
- Make Decisions: Leverage the valuation outcomes to inform your investment choices.
Why Choose This Calculator for Canoo Inc. (GOEV)?
- Accuracy: Utilizes real Canoo financials to ensure precise data.
- Flexibility: Users can easily test and adjust inputs as needed.
- Time-Saving: Avoid the complexities of building a DCF model from the ground up.
- Professional-Grade: Crafted with the precision and usability expected by financial executives.
- User-Friendly: Intuitive design makes it accessible for those without extensive financial modeling skills.
Who Should Use This Product?
- Investors: Accurately assess Canoo Inc.'s (GOEV) fair value prior to making investment choices.
- CFOs: Utilize a high-quality DCF model for financial reporting and analysis regarding Canoo Inc. (GOEV).
- Consultants: Efficiently modify the template for valuation reports tailored to clients interested in Canoo Inc. (GOEV).
- Entrepreneurs: Acquire insights into the financial modeling practices of leading companies, including Canoo Inc. (GOEV).
- Educators: Employ it as a teaching resource to illustrate valuation techniques relevant to Canoo Inc. (GOEV).
What the Template Contains
- Pre-Filled DCF Model: Canoo Inc.'s (GOEV) financial data preloaded for immediate use.
- WACC Calculator: Detailed calculations for Weighted Average Cost of Capital.
- Financial Ratios: Evaluate Canoo Inc.'s (GOEV) profitability, leverage, and efficiency.
- Editable Inputs: Change assumptions such as growth, margins, and CAPEX to fit your scenarios.
- Financial Statements: Annual and quarterly reports to support detailed analysis.
- Interactive Dashboard: Easily visualize key valuation metrics and results.
Disclaimer
All information, articles, and product details provided on this website are for general informational and educational purposes only. We do not claim any ownership over, nor do we intend to infringe upon, any trademarks, copyrights, logos, brand names, or other intellectual property mentioned or depicted on this site. Such intellectual property remains the property of its respective owners, and any references here are made solely for identification or informational purposes, without implying any affiliation, endorsement, or partnership.
We make no representations or warranties, express or implied, regarding the accuracy, completeness, or suitability of any content or products presented. Nothing on this website should be construed as legal, tax, investment, financial, medical, or other professional advice. In addition, no part of this site—including articles or product references—constitutes a solicitation, recommendation, endorsement, advertisement, or offer to buy or sell any securities, franchises, or other financial instruments, particularly in jurisdictions where such activity would be unlawful.
All content is of a general nature and may not address the specific circumstances of any individual or entity. It is not a substitute for professional advice or services. Any actions you take based on the information provided here are strictly at your own risk. You accept full responsibility for any decisions or outcomes arising from your use of this website and agree to release us from any liability in connection with your use of, or reliance upon, the content or products found herein.