
|
Graphite India Limited (GRAPHITE.NS) DCF Valuation |
Fully Editable: Tailor To Your Needs In Excel Or Sheets
Professional Design: Trusted, Industry-Standard Templates
Investor-Approved Valuation Models
MAC/PC Compatible, Fully Unlocked
No Expertise Is Needed; Easy To Follow
Graphite India Limited (GRAPHITE.NS) Bundle
Simplify Graphite India Limited valuation with this customizable DCF Calculator! Featuring real Graphite India Limited financials and adjustable forecast inputs, you can test scenarios and uncover Graphite India Limited's fair value in minutes.
Discounted Cash Flow (DCF) - (USD MM)
| Year | AY1 2021 |
AY2 2022 |
AY3 2023 |
AY4 2024 |
AY5 2025 |
FY1 2026 |
FY2 2027 |
FY3 2028 |
FY4 2029 |
FY5 2030 |
|---|---|---|---|---|---|---|---|---|---|---|
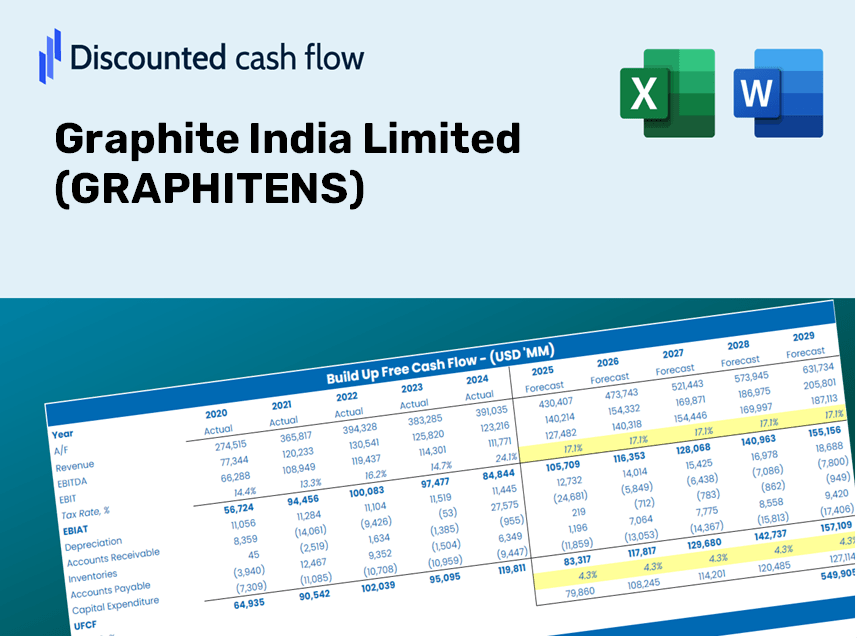
| Revenue | 19,576.2 | 30,265.1 | 31,809.2 | 29,496.9 | 25,600.3 | 28,110.7 | 30,867.2 | 33,894.0 | 37,217.7 | 40,867.2 |
| Revenue Growth, % | 0 | 54.6 | 5.1 | -7.27 | -13.21 | 9.81 | 9.81 | 9.81 | 9.81 | 9.81 |
| EBITDA | -926.0 | 4,770.5 | 3,139.2 | -1,443.7 | 2,528.7 | 1,455.2 | 1,597.9 | 1,754.6 | 1,926.7 | 2,115.6 |
| EBITDA, % | -4.73 | 15.76 | 9.87 | -4.89 | 9.88 | 5.18 | 5.18 | 5.18 | 5.18 | 5.18 |
| Depreciation | 508.5 | 539.3 | 555.3 | 798.9 | 889.6 | 692.0 | 759.9 | 834.4 | 916.2 | 1,006.0 |
| Depreciation, % | 2.6 | 1.78 | 1.75 | 2.71 | 3.47 | 2.46 | 2.46 | 2.46 | 2.46 | 2.46 |
| EBIT | -1,434.5 | 4,231.2 | 2,583.9 | -2,242.6 | 1,639.1 | 763.2 | 838.1 | 920.3 | 1,010.5 | 1,109.6 |
| EBIT, % | -7.33 | 13.98 | 8.12 | -7.6 | 6.4 | 2.72 | 2.72 | 2.72 | 2.72 | 2.72 |
| Total Cash | 21,252.2 | 18,195.6 | 14,279.2 | 26,946.4 | 32,020.0 | 22,284.1 | 24,469.3 | 26,868.8 | 29,503.5 | 32,396.6 |
| Total Cash, percent | .0 | .0 | .0 | .0 | .0 | .0 | .0 | .0 | .0 | .0 |
| Account Receivables | 3,957.5 | 6,058.2 | 5,707.0 | 5,218.4 | 4,990.7 | 5,361.3 | 5,887.0 | 6,464.3 | 7,098.2 | 7,794.2 |
| Account Receivables, % | 20.22 | 20.02 | 17.94 | 17.69 | 19.49 | 19.07 | 19.07 | 19.07 | 19.07 | 19.07 |
| Inventories | 10,164.7 | 17,133.8 | 23,280.0 | 13,539.0 | 11,860.0 | 15,401.8 | 16,912.1 | 18,570.5 | 20,391.5 | 22,391.1 |
| Inventories, % | 51.92 | 56.61 | 73.19 | 45.9 | 46.33 | 54.79 | 54.79 | 54.79 | 54.79 | 54.79 |
| Accounts Payable | 2,299.7 | 4,482.3 | 3,025.6 | 1,605.6 | 2,640.0 | 2,913.7 | 3,199.4 | 3,513.1 | 3,857.6 | 4,235.9 |
| Accounts Payable, % | 11.75 | 14.81 | 9.51 | 5.44 | 10.31 | 10.36 | 10.36 | 10.36 | 10.36 | 10.36 |
| Capital Expenditure | -769.0 | -917.5 | -1,700.0 | -2,596.9 | -1,680.0 | -1,555.7 | -1,708.2 | -1,875.7 | -2,059.7 | -2,261.6 |
| Capital Expenditure, % | -3.93 | -3.03 | -5.34 | -8.8 | -6.56 | -5.53 | -5.53 | -5.53 | -5.53 | -5.53 |
| Tax Rate, % | 21.85 | 21.85 | 21.85 | 21.85 | 21.85 | 21.85 | 21.85 | 21.85 | 21.85 | 21.85 |
| EBITAT | 1,075.0 | 3,082.5 | 1,600.2 | -1,782.7 | 1,280.9 | 446.4 | 490.1 | 538.2 | 591.0 | 648.9 |
| Depreciation | ||||||||||
| Changes in Account Receivables | ||||||||||
| Changes in Inventories | ||||||||||
| Changes in Accounts Payable | ||||||||||
| Capital Expenditure | ||||||||||
| UFCF | -11,008.0 | -4,182.9 | -6,796.2 | 5,228.9 | 3,431.6 | -4,056.0 | -2,208.5 | -2,425.1 | -2,662.9 | -2,924.0 |
| WACC, % | 8.53 | 8.6 | 8.59 | 8.6 | 8.6 | 8.58 | 8.58 | 8.58 | 8.58 | 8.58 |
| PV UFCF | ||||||||||
| SUM PV UFCF | -11,355.4 | |||||||||
| Long Term Growth Rate, % | 4.00 | |||||||||
| Free cash flow (T + 1) | -3,041 | |||||||||
| Terminal Value | -66,341 | |||||||||
| Present Terminal Value | -43,949 | |||||||||
| Enterprise Value | -55,305 | |||||||||
| Net Debt | -100 | |||||||||
| Equity Value | -55,205 | |||||||||
| Diluted Shares Outstanding, MM | 195 | |||||||||
| Equity Value Per Share | -282.60 |
Benefits You Will Experience
- Authentic GRAPHITENS Financials: Access to both historical and projected data for precise valuation.
- Customizable Inputs: Adjust parameters such as WACC, tax rates, revenue growth, and capital expenditures.
- Automated Calculations: Dynamic calculations for intrinsic value and NPV.
- Scenario Analysis: Explore various scenarios to assess Graphite India Limited’s future performance.
- User-Friendly Design: Designed for professionals while remaining easy to navigate for newcomers.
Highlighted Features
- Customizable Forecast Inputs: Adjust essential variables such as revenue growth, EBITDA margin, and capital expenditures.
- Instant DCF Valuation: Quickly computes intrinsic value, NPV, and other financial metrics.
- High-Precision Accuracy: Leverages Graphite India Limited’s (GRAPHITENS) actual financial data for realistic valuation results.
- Effortless Scenario Analysis: Easily explore various assumptions and analyze different outcomes.
- Time-Efficient Solution: Save time by avoiding the creation of intricate valuation models from the ground up.
How It Works
- 1. Open the Template: Download and access the Excel file containing Graphite India Limited’s (GRAPHITENS) preloaded data.
- 2. Edit Assumptions: Modify essential inputs such as growth rates, WACC, and capital expenditures as needed.
- 3. View Results Instantly: The DCF model automatically computes intrinsic value and NPV for your analysis.
- 4. Test Scenarios: Evaluate various forecasts to explore different valuation outcomes.
- 5. Use with Confidence: Share professional valuation insights to reinforce your decision-making process.
Why Choose This Calculator for Graphite India Limited (GRAPHITENS)?
- All-in-One Solution: Features DCF, WACC, and financial ratio analyses seamlessly integrated.
- Flexible Parameters: Modify the yellow-highlighted fields to explore different scenarios.
- In-Depth Analysis: Automatically computes Graphite India Limited’s intrinsic value and Net Present Value.
- Preloaded Information: Comes with historical and projected data for reliable assessments.
- High-Quality Standards: Perfect for financial analysts, investors, and business consultants.
Who Should Consider Graphite India Limited (GRAPHITENS)?
- Investors: Make informed decisions with a robust analysis of Graphite India Limited's potential.
- Financial Analysts: Streamline your assessments using comprehensive data tailored for Graphite India Limited.
- Consultants: Effortlessly modify insights for client presentations or advisory reports on Graphite India Limited.
- Finance Enthusiasts: Enhance your knowledge of the graphite industry through Graphite India Limited's performance and metrics.
- Educators and Students: Utilize this as a hands-on resource in finance and investment studies focusing on Graphite India Limited.
Contents of the Template
- Pre-Filled Data: Features Graphite India Limited’s historical financial data and projections.
- Discounted Cash Flow Model: Editable DCF valuation model with automatic computation capabilities.
- Weighted Average Cost of Capital (WACC): A dedicated worksheet for calculating WACC using customized inputs.
- Key Financial Ratios: Evaluate Graphite India Limited’s profitability, efficiency, and leverage metrics.
- Customizable Inputs: Easily modify revenue growth rates, margins, and tax percentages.
- Clear Dashboard: Visual summaries with charts and tables presenting essential valuation insights.
Disclaimer
All information, articles, and product details provided on this website are for general informational and educational purposes only. We do not claim any ownership over, nor do we intend to infringe upon, any trademarks, copyrights, logos, brand names, or other intellectual property mentioned or depicted on this site. Such intellectual property remains the property of its respective owners, and any references here are made solely for identification or informational purposes, without implying any affiliation, endorsement, or partnership.
We make no representations or warranties, express or implied, regarding the accuracy, completeness, or suitability of any content or products presented. Nothing on this website should be construed as legal, tax, investment, financial, medical, or other professional advice. In addition, no part of this site—including articles or product references—constitutes a solicitation, recommendation, endorsement, advertisement, or offer to buy or sell any securities, franchises, or other financial instruments, particularly in jurisdictions where such activity would be unlawful.
All content is of a general nature and may not address the specific circumstances of any individual or entity. It is not a substitute for professional advice or services. Any actions you take based on the information provided here are strictly at your own risk. You accept full responsibility for any decisions or outcomes arising from your use of this website and agree to release us from any liability in connection with your use of, or reliance upon, the content or products found herein.