
|
The Goldman Sachs Group, Inc. PFD 1/1000 C (GS-PC) DCF Valuation |
Fully Editable: Tailor To Your Needs In Excel Or Sheets
Professional Design: Trusted, Industry-Standard Templates
Investor-Approved Valuation Models
MAC/PC Compatible, Fully Unlocked
No Expertise Is Needed; Easy To Follow
The Goldman Sachs Group, Inc. PFD 1/1000 C (GS-PC) Bundle
Explore the financial prospects of The Goldman Sachs Group, Inc. with our user-friendly DCF Calculator! Enter your assumptions regarding growth, margins, and expenses to determine the intrinsic value of The Goldman Sachs Group, Inc. (GS-PC) and shape your investment approach.
What You Will Receive
- Customizable Excel Template: A fully editable Excel-based DCF Calculator featuring pre-filled financial data for Goldman Sachs (GS-PC).
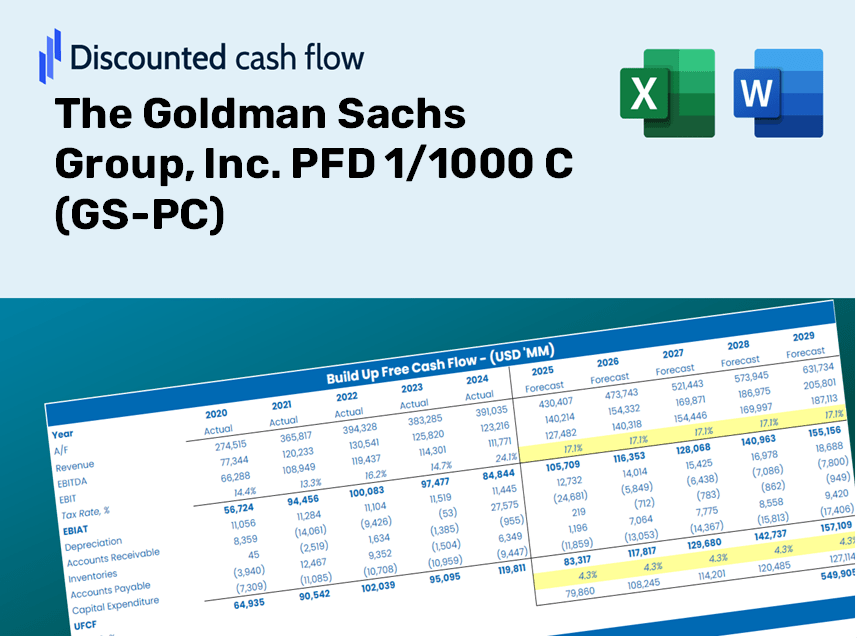
- Genuine Market Data: Access to historical data and forward-looking projections (highlighted in the yellow cells).
- Adjustable Assumptions: Modify key forecast parameters such as revenue growth, EBITDA %, and WACC.
- Instant Calculations: Quickly observe how your inputs influence the valuation of Goldman Sachs.
- Professional Resource: Designed for use by investors, CFOs, consultants, and financial analysts.
- Intuitive Layout: Organized for straightforward navigation and ease of use, complete with step-by-step guidance.
Key Features
- Comprehensive DCF Calculator: Features detailed unlevered and levered DCF valuation frameworks tailored for The Goldman Sachs Group, Inc. PFD 1/1000 C (GS-PC).
- WACC Analysis Tool: Pre-configured Weighted Average Cost of Capital calculator with adjustable parameters specific to GS-PC.
- Customizable Forecast Inputs: Adjust growth projections, capital allocations, and discount rates to fit your analysis.
- Integrated Financial Ratios: Evaluate key profitability, leverage, and operational efficiency metrics for The Goldman Sachs Group, Inc. PFD 1/1000 C (GS-PC).
- Interactive Dashboard and Visualizations: Graphical representations for a clear overview of essential valuation indicators.
How It Operates
- Download the Template: Gain immediate access to the Excel-based GS-PC DCF Calculator.
- Input Your Assumptions: Modify the yellow-highlighted cells for growth rates, WACC, margins, and other variables.
- Instant Calculations: The model automatically calculates the intrinsic value of Goldman Sachs Group, Inc.
- Test Scenarios: Experiment with various assumptions to assess potential changes in valuation.
- Analyze and Decide: Leverage the outcomes to inform your investment or financial evaluation.
Why Choose This Calculator for The Goldman Sachs Group, Inc. PFD 1/1000 C (GS-PC)?
- Accurate Data: Dependable financial metrics directly linked to The Goldman Sachs Group, ensuring trustworthy valuation outcomes.
- Customizable: Modify essential variables such as growth rates, WACC, and tax rates to align with your financial forecasts.
- Time-Saving: Ready-made calculations allow you to avoid starting from square one.
- Professional-Grade Tool: Tailored for investors, analysts, and financial consultants.
- User-Friendly: An intuitive design and clear step-by-step guidance make it accessible for all users.
Who Can Benefit from This Product?
- Investors: Make informed investment choices with a sophisticated valuation tool tailored for professionals.
- Financial Analysts: Streamline your workflow with a customizable DCF model designed for efficiency.
- Consultants: Easily modify the template to suit client presentations or detailed reports.
- Finance Enthusiasts: Enhance your grasp of valuation methods by examining practical, real-world scenarios.
- Educators and Students: Utilize this resource as a valuable tool for learning in finance-focused coursework.
Contents of the Template
- Pre-Filled DCF Model: Financial data for The Goldman Sachs Group, Inc. (GS-PC) preloaded for immediate application.
- WACC Calculator: Comprehensive calculations for the Weighted Average Cost of Capital.
- Financial Ratios: Assess the profitability, leverage, and efficiency of The Goldman Sachs Group, Inc. (GS-PC).
- Editable Inputs: Modify assumptions such as growth rates, margins, and CAPEX to suit your analysis.
- Financial Statements: Access annual and quarterly reports for in-depth examination.
- Interactive Dashboard: Effortlessly visualize essential valuation metrics and outcomes.
Disclaimer
All information, articles, and product details provided on this website are for general informational and educational purposes only. We do not claim any ownership over, nor do we intend to infringe upon, any trademarks, copyrights, logos, brand names, or other intellectual property mentioned or depicted on this site. Such intellectual property remains the property of its respective owners, and any references here are made solely for identification or informational purposes, without implying any affiliation, endorsement, or partnership.
We make no representations or warranties, express or implied, regarding the accuracy, completeness, or suitability of any content or products presented. Nothing on this website should be construed as legal, tax, investment, financial, medical, or other professional advice. In addition, no part of this site—including articles or product references—constitutes a solicitation, recommendation, endorsement, advertisement, or offer to buy or sell any securities, franchises, or other financial instruments, particularly in jurisdictions where such activity would be unlawful.
All content is of a general nature and may not address the specific circumstances of any individual or entity. It is not a substitute for professional advice or services. Any actions you take based on the information provided here are strictly at your own risk. You accept full responsibility for any decisions or outcomes arising from your use of this website and agree to release us from any liability in connection with your use of, or reliance upon, the content or products found herein.