
|
HDFC Bank Limited (HDFCBANK.NS) DCF Valuation |
Fully Editable: Tailor To Your Needs In Excel Or Sheets
Professional Design: Trusted, Industry-Standard Templates
Investor-Approved Valuation Models
MAC/PC Compatible, Fully Unlocked
No Expertise Is Needed; Easy To Follow
HDFC Bank Limited (HDFCBANK.NS) Bundle
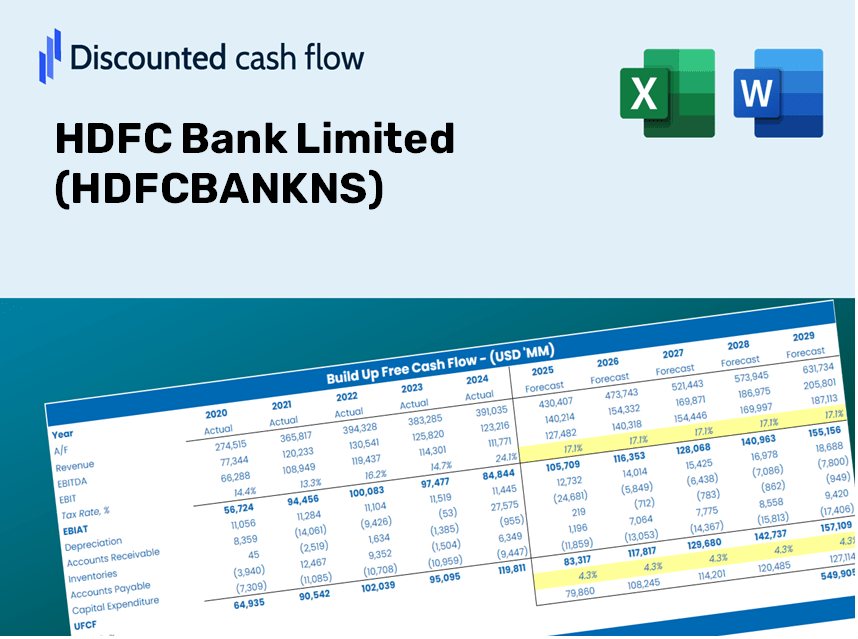
Engineered for accuracy, our HDFC Bank Limited (HDFCBANKNS) DCF Calculator enables you to evaluate the company's valuation using real-world financial data, offering complete flexibility to modify all key parameters for more accurate projections.
Discounted Cash Flow (DCF) - (USD MM)
| Year | AY1 2021 |
AY2 2022 |
AY3 2023 |
AY4 2024 |
AY5 2025 |
FY1 2026 |
FY2 2027 |
FY3 2028 |
FY4 2029 |
FY5 2030 |
|---|---|---|---|---|---|---|---|---|---|---|
| Revenue | 1,528,943.3 | 911,858.1 | 1,130,320.8 | 2,288,379.4 | 4,709,150.0 | 6,870,623.1 | 10,024,200.2 | 14,625,251.1 | 21,338,158.4 | 31,132,252.0 |
| Revenue Growth, % | 0 | -40.36 | 23.96 | 102.45 | 105.79 | 45.9 | 45.9 | 45.9 | 45.9 | 45.9 |
| EBITDA | 441,821.7 | 525,550.7 | 638,473.6 | 757,807.3 | 2,840,280.0 | 3,249,089.0 | 4,740,402.4 | 6,916,220.2 | 10,090,726.0 | 14,722,312.0 |
| EBITDA, % | 28.9 | 57.64 | 56.49 | 33.12 | 60.31 | 47.29 | 47.29 | 47.29 | 47.29 | 47.29 |
| Depreciation | 13,850.1 | 16,807.3 | 23,454.7 | 52,348.3 | 38,923.0 | 109,080.9 | 159,148.4 | 232,196.6 | 338,773.6 | 494,268.7 |
| Depreciation, % | 0.90586 | 1.84 | 2.08 | 2.29 | 0.82654 | 1.59 | 1.59 | 1.59 | 1.59 | 1.59 |
| EBIT | 427,971.6 | 508,743.4 | 615,018.9 | 705,459.0 | 2,801,357.0 | 3,140,008.1 | 4,581,254.0 | 6,684,023.6 | 9,751,952.5 | 14,228,043.3 |
| EBIT, % | 27.99 | 55.79 | 54.41 | 30.83 | 59.49 | 45.7 | 45.7 | 45.7 | 45.7 | 45.7 |
| Total Cash | 5,316,832.7 | 4,339,570.0 | 7,242,764.2 | 9,929,312.8 | 9,196,249.4 | 6,870,623.1 | 10,024,200.2 | 14,625,251.1 | 21,338,158.4 | 31,132,252.0 |
| Total Cash, percent | .0 | .0 | .0 | .0 | .0 | .0 | .0 | .0 | .0 | .0 |
| Account Receivables | 204,362.3 | 188,526.1 | 278,751.2 | 379,127.8 | 454,645.4 | 1,166,968.0 | 1,702,599.7 | 2,484,083.2 | 3,624,263.3 | 5,287,779.6 |
| Account Receivables, % | 13.37 | 20.67 | 24.66 | 16.57 | 9.65 | 16.98 | 16.98 | 16.98 | 16.98 | 16.98 |
| Inventories | .0 | -10,471,822.6 | -2,158,847.8 | .0 | .0 | -2,748,249.3 | -4,009,680.1 | -5,850,100.5 | -8,535,263.4 | -12,452,900.8 |
| Inventories, % | 0 | -1148.4 | -190.99 | 0 | 0 | -40 | -40 | -40 | -40 | -40 |
| Accounts Payable | 346,038.0 | 234,722.0 | 437,291.1 | 531,484.8 | 576,840.5 | 1,683,792.4 | 2,456,643.5 | 3,584,229.0 | 5,229,369.8 | 7,629,620.8 |
| Accounts Payable, % | 22.63 | 25.74 | 38.69 | 23.23 | 12.25 | 24.51 | 24.51 | 24.51 | 24.51 | 24.51 |
| Capital Expenditure | -16,961.5 | -26,324.4 | -43,620.3 | -53,838.0 | -40,758.9 | -152,164.5 | -222,007.2 | -323,907.2 | -472,578.8 | -689,489.7 |
| Capital Expenditure, % | -1.11 | -2.89 | -3.86 | -2.35 | -0.86553 | -2.21 | -2.21 | -2.21 | -2.21 | -2.21 |
| Tax Rate, % | 26.44 | 26.44 | 26.44 | 26.44 | 26.44 | 26.44 | 26.44 | 26.44 | 26.44 | 26.44 |
| EBITAT | 325,984.9 | 380,534.7 | 459,997.3 | 590,230.8 | 2,060,575.3 | 2,405,153.4 | 3,509,105.1 | 5,119,764.5 | 7,469,707.3 | 10,898,260.6 |
| Depreciation | ||||||||||
| Changes in Account Receivables | ||||||||||
| Changes in Inventories | ||||||||||
| Changes in Accounts Payable | ||||||||||
| Capital Expenditure | ||||||||||
| UFCF | 464,549.1 | 10,747,360.4 | -7,760,799.1 | -1,576,289.6 | 2,028,577.5 | 5,504,948.3 | 4,944,896.7 | 7,214,576.2 | 10,526,025.7 | 15,357,411.8 |
| WACC, % | 11.11 | 10.99 | 10.99 | 11.76 | 10.88 | 11.15 | 11.15 | 11.15 | 11.15 | 11.15 |
| PV UFCF | ||||||||||
| SUM PV UFCF | 30,161,896.3 | |||||||||
| Long Term Growth Rate, % | 2.00 | |||||||||
| Free cash flow (T + 1) | 15,664,560 | |||||||||
| Terminal Value | 171,273,047 | |||||||||
| Present Terminal Value | 100,976,582 | |||||||||
| Enterprise Value | 131,138,479 | |||||||||
| Net Debt | 3,846,577 | |||||||||
| Equity Value | 127,291,902 | |||||||||
| Diluted Shares Outstanding, MM | 15,319 | |||||||||
| Equity Value Per Share | 8,309.48 |
What You Will Receive
- Authentic HDFC Bank Data: Preloaded financial metrics – from revenue to EBIT – based on both actual and projected figures.
- Complete Customization: Modify all essential parameters (yellow cells) such as WACC, growth %, and tax rates.
- Immediate Valuation Updates: Automatic recalibrations to assess the effect of changes on HDFC Bank’s fair value.
- Flexible Excel Template: Designed for quick edits, scenario analysis, and comprehensive projections.
- Efficient and Accurate: Bypass the hassle of building models from scratch while ensuring precision and adaptability.
Key Features
- 🔍 Real-Life HDFC Bank Financials: Pre-filled historical and projected data for HDFC Bank Limited (HDFCBANKNS).
- ✏️ Fully Customizable Inputs: Modify all essential parameters (yellow cells) such as WACC, growth %, and tax rates.
- 📊 Professional DCF Valuation: Integrated formulas compute HDFC Bank’s intrinsic value utilizing the Discounted Cash Flow method.
- ⚡ Instant Results: Immediately visualize HDFC Bank’s valuation upon making adjustments.
- Scenario Analysis: Evaluate and compare outcomes for different financial scenarios side-by-side.
How It Works
- Step 1: Download the prebuilt Excel template that includes HDFC Bank Limited's data.
- Step 2: Familiarize yourself with the pre-filled sheets and key performance indicators.
- Step 3: Modify forecasts and assumptions in the editable yellow cells (WACC, growth, margins).
- Step 4: Instantly see the recalculated results, including HDFC Bank Limited's intrinsic value.
- Step 5: Utilize the outputs to make informed investment decisions or create detailed reports.
Why Choose This Calculator for HDFC Bank Limited (HDFCBANKNS)?
- Designed for Experts: A sophisticated tool utilized by financial analysts, CFOs, and consultants.
- Accurate Financial Data: HDFC Bank's historical and anticipated financials are preloaded for precision.
- Scenario Analysis: Effortlessly test various forecasts and assumptions.
- Comprehensive Outputs: Automatically computes intrinsic value, NPV, and essential metrics.
- User-Friendly: Clear, step-by-step guidance to help you navigate the tool with ease.
Who Can Benefit from This Product?
- Individual Investors: Gain insights to make informed decisions when buying or selling HDFC Bank Limited (HDFCBANKNS) stock.
- Financial Analysts: Enhance your valuation processes with accessible and efficient financial models.
- Consultants: Provide clients with timely and precise valuation analyses for HDFC Bank Limited (HDFCBANKNS).
- Business Owners: Learn about the valuation of large entities like HDFC Bank Limited (HDFCBANKNS) to inform your business strategies.
- Finance Students: Acquire practical knowledge of valuation methodologies using real data and scenarios related to HDFC Bank Limited (HDFCBANKNS).
Contents of the Template
- Operating and Balance Sheet Data: Pre-filled historical data and forecasts for HDFC Bank Limited (HDFCBANKNS), including revenue, EBITDA, EBIT, and capital expenditures.
- WACC Calculation: A dedicated sheet for calculating the Weighted Average Cost of Capital (WACC), featuring parameters such as Beta, risk-free rate, and share price.
- DCF Valuation (Unlevered and Levered): Customizable Discounted Cash Flow models that present intrinsic value, complete with detailed calculations.
- Financial Statements: Pre-loaded annual and quarterly financial statements to facilitate thorough analysis.
- Key Ratios: Includes profitability, leverage, and efficiency ratios relevant to HDFC Bank Limited (HDFCBANKNS).
- Dashboard and Charts: A visual summary of valuation outputs and assumptions, designed for easy result analysis.
Disclaimer
All information, articles, and product details provided on this website are for general informational and educational purposes only. We do not claim any ownership over, nor do we intend to infringe upon, any trademarks, copyrights, logos, brand names, or other intellectual property mentioned or depicted on this site. Such intellectual property remains the property of its respective owners, and any references here are made solely for identification or informational purposes, without implying any affiliation, endorsement, or partnership.
We make no representations or warranties, express or implied, regarding the accuracy, completeness, or suitability of any content or products presented. Nothing on this website should be construed as legal, tax, investment, financial, medical, or other professional advice. In addition, no part of this site—including articles or product references—constitutes a solicitation, recommendation, endorsement, advertisement, or offer to buy or sell any securities, franchises, or other financial instruments, particularly in jurisdictions where such activity would be unlawful.
All content is of a general nature and may not address the specific circumstances of any individual or entity. It is not a substitute for professional advice or services. Any actions you take based on the information provided here are strictly at your own risk. You accept full responsibility for any decisions or outcomes arising from your use of this website and agree to release us from any liability in connection with your use of, or reliance upon, the content or products found herein.