
|
HDFC Life Insurance Company Limited (HDFCLIFE.NS) DCF Valuation |
Fully Editable: Tailor To Your Needs In Excel Or Sheets
Professional Design: Trusted, Industry-Standard Templates
Investor-Approved Valuation Models
MAC/PC Compatible, Fully Unlocked
No Expertise Is Needed; Easy To Follow
HDFC Life Insurance Company Limited (HDFCLIFE.NS) Bundle
Discover the true potential of HDFC Life Insurance Company Limited (HDFCLIFENS) with our advanced DCF Calculator! Adjust key assumptions, explore various scenarios, and evaluate how changes affect the valuation of HDFC Life Insurance Company Limited (HDFCLIFENS) – all within one convenient Excel template.
What You Will Receive
- Comprehensive HDFC Life Financials: Access historical and projected data for precise valuation.
- Customizable Inputs: Adjust parameters such as WACC, tax rates, premium growth, and operational expenses.
- Automated Calculations: Intrinsic value and NPV calculated in real-time.
- Scenario Analysis: Explore various scenarios to assess HDFC Life’s future performance.
- User-Friendly Interface: Designed for industry experts but easy for newcomers to navigate.
Key Features
- Comprehensive Data: HDFC Life's historical performance metrics and pre-populated forecasts.
- Customizable Parameters: Modify WACC, tax rates, growth rates, and profit margins as needed.
- Real-Time Analysis: Instantly observe recalculated intrinsic value for HDFC Life Insurance Company Limited (HDFCLIFENS).
- Visually Engaging Outputs: Dashboard graphs present valuation outcomes and essential financial indicators.
- Engineered for Precision: A professional-grade resource for analysts, investors, and finance professionals.
How It Works
- Step 1: Download the Excel file.
- Step 2: Review the pre-filled data for HDFC Life Insurance Company Limited (HDFCLIFENS), including historical and projected figures.
- Step 3: Modify key assumptions (highlighted in yellow) based on your insights.
- Step 4: Observe the automatic recalculations of HDFC Life’s intrinsic value.
- Step 5: Utilize the results for your investment strategies or reporting needs.
Why Opt for This Calculator?
- Designed for Professionals: A sophisticated tool utilized by financial analysts, actuaries, and insurance consultants.
- Comprehensive Data: HDFC Life Insurance’s historical and projected metrics are preloaded for precision.
- Scenario Analysis: Effortlessly test various projections and hypotheses.
- Clear Results: Automatically calculates intrinsic value, NPV, and essential indicators.
- User-Friendly: Detailed instructions walk you through each step of the process.
Who Should Use HDFC Life Insurance Company Limited (HDFCLIFENS)?
- Investors: Accurately assess the value of HDFC Life Insurance before making investment choices.
- CFOs: Utilize a professional-grade financial model for comprehensive reporting and analysis.
- Consultants: Swiftly adapt the template for client valuation reports relevant to HDFC Life.
- Entrepreneurs: Acquire insights into the financial modeling practices of leading insurance companies.
- Educators: Employ it as an instructional resource to illustrate various valuation techniques.
What the Template Includes
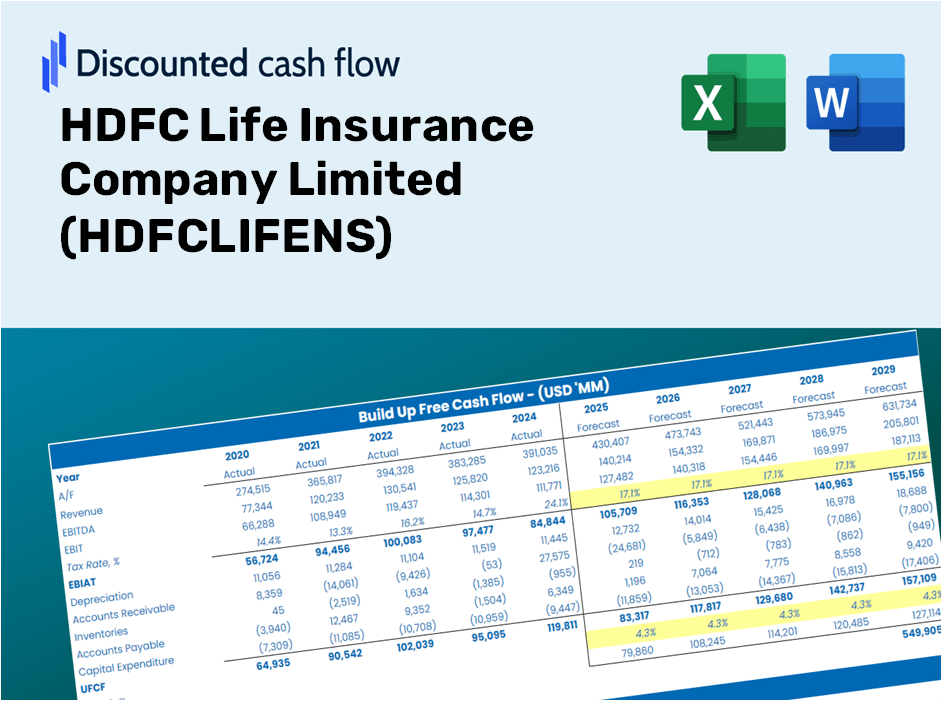
- Operating and Balance Sheet Data: Pre-populated historical data and forecasts for HDFC Life Insurance Company Limited (HDFCLIFENS), covering metrics such as revenue, EBITDA, EBIT, and capital expenditures.
- WACC Calculation: A dedicated sheet for calculating the Weighted Average Cost of Capital (WACC), featuring parameters like Beta, risk-free rate, and share price.
- DCF Valuation (Unlevered and Levered): Customizable Discounted Cash Flow models that depict intrinsic value along with comprehensive calculations.
- Financial Statements: Pre-loaded annual and quarterly financial statements to facilitate in-depth analysis.
- Key Ratios: Incorporates profitability, leverage, and efficiency ratios specific to HDFC Life Insurance Company Limited (HDFCLIFENS).
- Dashboard and Charts: A visual overview of valuation outputs and underlying assumptions for easier result analysis.
Disclaimer
All information, articles, and product details provided on this website are for general informational and educational purposes only. We do not claim any ownership over, nor do we intend to infringe upon, any trademarks, copyrights, logos, brand names, or other intellectual property mentioned or depicted on this site. Such intellectual property remains the property of its respective owners, and any references here are made solely for identification or informational purposes, without implying any affiliation, endorsement, or partnership.
We make no representations or warranties, express or implied, regarding the accuracy, completeness, or suitability of any content or products presented. Nothing on this website should be construed as legal, tax, investment, financial, medical, or other professional advice. In addition, no part of this site—including articles or product references—constitutes a solicitation, recommendation, endorsement, advertisement, or offer to buy or sell any securities, franchises, or other financial instruments, particularly in jurisdictions where such activity would be unlawful.
All content is of a general nature and may not address the specific circumstances of any individual or entity. It is not a substitute for professional advice or services. Any actions you take based on the information provided here are strictly at your own risk. You accept full responsibility for any decisions or outcomes arising from your use of this website and agree to release us from any liability in connection with your use of, or reliance upon, the content or products found herein.