
|
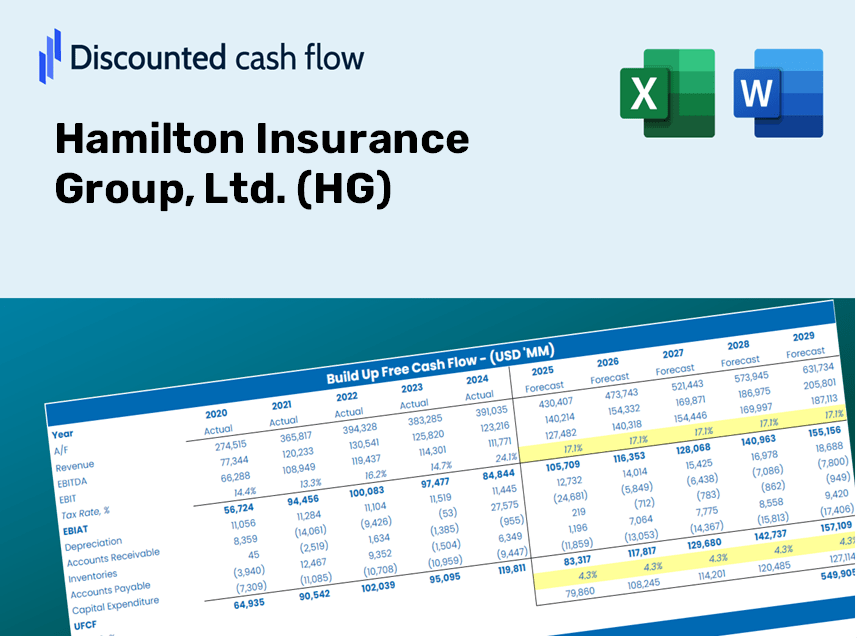
Hamilton Insurance Group, Ltd. (HG) DCF Valuation |
Fully Editable: Tailor To Your Needs In Excel Or Sheets
Professional Design: Trusted, Industry-Standard Templates
Investor-Approved Valuation Models
MAC/PC Compatible, Fully Unlocked
No Expertise Is Needed; Easy To Follow
Hamilton Insurance Group, Ltd. (HG) Bundle
Looking to estimate the intrinsic value of Hamilton Insurance Group, Ltd.? Our (HG) DCF Calculator integrates real-world data with comprehensive customization features, allowing you to refine your forecasts and make more informed investment choices.
Discounted Cash Flow (DCF) - (USD MM)
| Year | AY1 2020 |
AY2 2021 |
AY3 2022 |
AY4 2023 |
AY5 2024 |
FY1 2025 |
FY2 2026 |
FY3 2027 |
FY4 2028 |
FY5 2029 |
|---|---|---|---|---|---|---|---|---|---|---|
| Revenue | 690.3 | 768.2 | 1,226.9 | 1,571.0 | 2,329.9 | 3,188.2 | 4,362.7 | 5,969.9 | 8,169.1 | 11,178.5 |
| Revenue Growth, % | 0 | 11.28 | 59.72 | 28.05 | 48.3 | 36.84 | 36.84 | 36.84 | 36.84 | 36.84 |
| EBITDA | -160.0 | -110.9 | 3.9 | 289.1 | 660.6 | 60.2 | 82.4 | 112.8 | 154.4 | 211.2 |
| EBITDA, % | -23.18 | -14.44 | 0.3182 | 18.4 | 28.35 | 1.89 | 1.89 | 1.89 | 1.89 | 1.89 |
| Depreciation | 14.0 | 13.9 | 15.0 | 12.4 | 16.5 | 41.8 | 57.2 | 78.3 | 107.1 | 146.5 |
| Depreciation, % | 2.03 | 1.81 | 1.22 | 0.78992 | 0.70672 | 1.31 | 1.31 | 1.31 | 1.31 | 1.31 |
| EBIT | -174.0 | -124.8 | -11.1 | 276.7 | 644.2 | 18.4 | 25.2 | 34.5 | 47.3 | 64.7 |
| EBIT, % | -25.21 | -16.25 | -0.90391 | 17.61 | 27.65 | 0.57861 | 0.57861 | 0.57861 | 0.57861 | 0.57861 |
| Total Cash | 1,441.7 | 1,076.4 | 1,223.4 | 1,493.6 | ||||||
| Total Cash, percent | .0 | .0 | .0 | .0 | ||||||
| Account Receivables | 1,723.8 | 1,791.6 | 2,007.1 | 2,151.2 | ||||||
| Account Receivables, % | 224.4 | 146.02 | 127.75 | 92.33 | ||||||
| Inventories | .0 | .0 | -2,801.6 | .0 | ||||||
| Inventories, % | 0 | 0 | -178.33 | 0 | ||||||
| Accounts Payable | 496.0 | 382.4 | 459.2 | 446.6 | ||||||
| Accounts Payable, % | 64.57 | 31.17 | 29.23 | 19.17 | ||||||
| Capital Expenditure | .0 | -153.5 | .0 | .0 | .0 | -127.4 | -174.3 | -238.5 | -326.4 | -446.7 |
| Capital Expenditure, % | 0 | -19.98 | 0 | 0 | 0 | -4 | -4 | -4 | -4 | -4 |
| Tax Rate, % | 35.58 | 35.58 | 35.58 | 35.58 | 35.58 | 35.58 | 35.58 | 35.58 | 35.58 | 35.58 |
| EBITAT | -210.4 | -129.6 | -40.5 | 280.5 | 415.0 | 17.1 | 23.4 | 32.1 | 43.9 | 60.1 |
| Depreciation | ||||||||||
| Changes in Account Receivables | ||||||||||
| Changes in Inventories | ||||||||||
| Changes in Accounts Payable | ||||||||||
| Capital Expenditure | ||||||||||
| UFCF | -196.5 | -1,497.0 | -206.9 | 2,955.8 | -2,526.8 | 1,636.1 | -93.7 | -128.2 | -175.4 | -240.1 |
| WACC, % | 7.93 | 7.93 | 7.93 | 7.93 | 7.62 | 7.87 | 7.87 | 7.87 | 7.87 | 7.87 |
| PV UFCF | ||||||||||
| SUM PV UFCF | 1,040.1 | |||||||||
| Long Term Growth Rate, % | 2.00 | |||||||||
| Free cash flow (T + 1) | -245 | |||||||||
| Terminal Value | -4,172 | |||||||||
| Present Terminal Value | -2,856 | |||||||||
| Enterprise Value | -1,816 | |||||||||
| Net Debt | -847 | |||||||||
| Equity Value | -970 | |||||||||
| Diluted Shares Outstanding, MM | 101 | |||||||||
| Equity Value Per Share | -9.56 |
What You Will Receive
- Customizable Excel Template: A fully adaptable Excel-based DCF Calculator featuring pre-populated financials for Hamilton Insurance Group, Ltd. (HG).
- Actual Data Insights: Access to historical data and forward-looking projections (highlighted in the yellow cells).
- Flexible Forecasting: Modify key assumptions such as revenue growth, EBITDA percentage, and WACC.
- Instant Calculations: Quickly observe how your inputs influence the valuation of Hamilton Insurance Group, Ltd. (HG).
- Professional Utility: Designed for use by investors, CFOs, consultants, and financial analysts.
- Intuitive Design: Organized for simplicity and ease of navigation, complete with step-by-step guidance.
Key Features
- Real Hamilton Insurance Data: Gain access to precise pre-loaded historical information and future forecasts.
- Customizable Assumptions for Forecasting: Modify the yellow-highlighted fields such as WACC, growth rates, and profit margins.
- Real-Time Calculations: Automatic updates for DCF, Net Present Value (NPV), and cash flow evaluations.
- Interactive Dashboard: User-friendly charts and summaries to effectively visualize your valuation outcomes.
- Designed for All Levels: An intuitive layout catering to investors, CFOs, and consultants, whether experienced or new.
How It Functions
- Step 1: Download the prebuilt Excel template featuring data for Hamilton Insurance Group, Ltd. (HG).
- Step 2: Review the pre-filled worksheets to familiarize yourself with the essential metrics.
- Step 3: Update your forecasts and assumptions in the editable yellow cells (WACC, growth, margins).
- Step 4: Instantly view the recalculated outcomes, including the intrinsic value of Hamilton Insurance Group, Ltd. (HG).
- Step 5: Utilize the outputs to make well-informed investment choices or generate comprehensive reports.
Why Opt for Hamilton Insurance Group’s Calculator?
- Designed for Industry Experts: A sophisticated tool favored by actuaries, financial analysts, and insurance consultants.
- Actual Market Data: Hamilton Insurance's historical and anticipated financial data is preloaded for precise results.
- Flexible Scenario Analysis: Easily model various forecasts and assumptions to gauge potential outcomes.
- Comprehensive Outputs: Automatically generates calculations for intrinsic value, NPV, and other vital metrics.
- User-Friendly Interface: Detailed step-by-step instructions to seamlessly navigate the calculation process.
Who Can Benefit from Hamilton Insurance Group, Ltd. (HG)?
- Investors: Assess the valuation of Hamilton Insurance Group (HG) before making investment decisions.
- CFOs and Financial Analysts: Optimize valuation workflows and validate financial forecasts.
- Startup Founders: Discover how established insurance companies like Hamilton Insurance Group (HG) are valued.
- Consultants: Provide detailed valuation reports to support your clients' needs.
- Students and Educators: Utilize real-time data for learning and practicing valuation methodologies.
Contents of the Template
- Pre-Filled DCF Model: Hamilton Insurance Group's (HG) financial data readily available for immediate application.
- WACC Calculator: Comprehensive calculations for the Weighted Average Cost of Capital.
- Financial Ratios: Assess Hamilton Insurance Group's profitability, leverage, and operational efficiency.
- Editable Inputs: Modify assumptions such as growth rates, margins, and capital expenditures to align with your scenarios.
- Financial Statements: Annual and quarterly reports to facilitate thorough analysis.
- Interactive Dashboard: Easily visualize essential valuation metrics and outcomes.
Disclaimer
All information, articles, and product details provided on this website are for general informational and educational purposes only. We do not claim any ownership over, nor do we intend to infringe upon, any trademarks, copyrights, logos, brand names, or other intellectual property mentioned or depicted on this site. Such intellectual property remains the property of its respective owners, and any references here are made solely for identification or informational purposes, without implying any affiliation, endorsement, or partnership.
We make no representations or warranties, express or implied, regarding the accuracy, completeness, or suitability of any content or products presented. Nothing on this website should be construed as legal, tax, investment, financial, medical, or other professional advice. In addition, no part of this site—including articles or product references—constitutes a solicitation, recommendation, endorsement, advertisement, or offer to buy or sell any securities, franchises, or other financial instruments, particularly in jurisdictions where such activity would be unlawful.
All content is of a general nature and may not address the specific circumstances of any individual or entity. It is not a substitute for professional advice or services. Any actions you take based on the information provided here are strictly at your own risk. You accept full responsibility for any decisions or outcomes arising from your use of this website and agree to release us from any liability in connection with your use of, or reliance upon, the content or products found herein.