
|
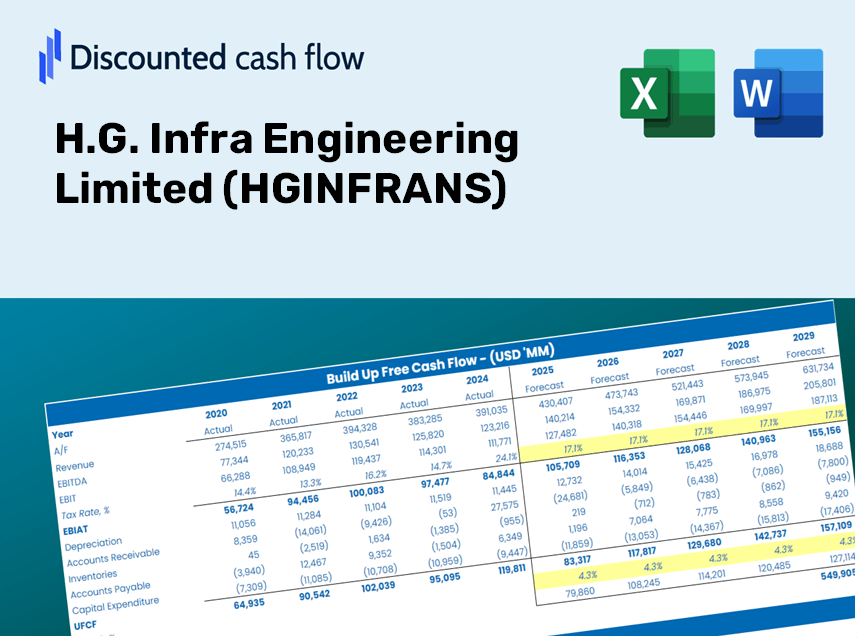
H.G. Infra Engineering Limited (HGINFRA.NS) DCF Valuation |
Fully Editable: Tailor To Your Needs In Excel Or Sheets
Professional Design: Trusted, Industry-Standard Templates
Investor-Approved Valuation Models
MAC/PC Compatible, Fully Unlocked
No Expertise Is Needed; Easy To Follow
H.G. Infra Engineering Limited (HGINFRA.NS) Bundle
Optimize your time and improve precision with our (HGINFRANS) DCF Calculator! Equipped with real data from H.G. Infra Engineering Limited and customizable assumptions, this tool enables you to forecast, analyze, and evaluate (HGINFRANS) just like a seasoned investor.
Discounted Cash Flow (DCF) - (USD MM)
| Year | AY1 2021 |
AY2 2022 |
AY3 2023 |
AY4 2024 |
AY5 2025 |
FY1 2026 |
FY2 2027 |
FY3 2028 |
FY4 2029 |
FY5 2030 |
|---|---|---|---|---|---|---|---|---|---|---|
| Revenue | 25,677.9 | 36,625.4 | 44,664.2 | 53,784.8 | 50,561.8 | 60,549.1 | 72,509.2 | 86,831.7 | 103,983.2 | 124,522.7 |
| Revenue Growth, % | 0 | 42.63 | 21.95 | 20.42 | -5.99 | 19.75 | 19.75 | 19.75 | 19.75 | 19.75 |
| EBITDA | 4,889.0 | 7,157.7 | 9,119.8 | 10,581.7 | 10,641.9 | 12,076.2 | 14,461.6 | 17,318.2 | 20,739.0 | 24,835.5 |
| EBITDA, % | 19.04 | 19.54 | 20.42 | 19.67 | 21.05 | 19.94 | 19.94 | 19.94 | 19.94 | 19.94 |
| Depreciation | 844.3 | 849.5 | 962.4 | 1,410.3 | 1,443.7 | 1,603.3 | 1,920.0 | 2,299.3 | 2,753.4 | 3,297.3 |
| Depreciation, % | 3.29 | 2.32 | 2.15 | 2.62 | 2.86 | 2.65 | 2.65 | 2.65 | 2.65 | 2.65 |
| EBIT | 4,044.6 | 6,308.2 | 8,157.4 | 9,171.4 | 9,198.2 | 10,472.9 | 12,541.6 | 15,018.9 | 17,985.6 | 21,538.2 |
| EBIT, % | 15.75 | 17.22 | 18.26 | 17.05 | 18.19 | 17.3 | 17.3 | 17.3 | 17.3 | 17.3 |
| Total Cash | 1,459.0 | 566.4 | 2,667.6 | 2,038.1 | 1,969.0 | 2,529.0 | 3,028.6 | 3,626.8 | 4,343.2 | 5,201.1 |
| Total Cash, percent | .0 | .0 | .0 | .0 | .0 | .0 | .0 | .0 | .0 | .0 |
| Account Receivables | 12,908.7 | 14,058.1 | 19,313.7 | 17,082.0 | 21,184.6 | 24,892.4 | 29,809.3 | 35,697.4 | 42,748.6 | 51,192.6 |
| Account Receivables, % | 50.27 | 38.38 | 43.24 | 31.76 | 41.9 | 41.11 | 41.11 | 41.11 | 41.11 | 41.11 |
| Inventories | 1,680.1 | 1,835.5 | 2,353.3 | 2,967.0 | 4,513.5 | 3,786.3 | 4,534.2 | 5,429.9 | 6,502.4 | 7,786.8 |
| Inventories, % | 6.54 | 5.01 | 5.27 | 5.52 | 8.93 | 6.25 | 6.25 | 6.25 | 6.25 | 6.25 |
| Accounts Payable | 4,145.9 | 4,320.2 | 7,241.8 | 8,357.8 | 12,709.0 | 10,272.8 | 12,302.0 | 14,731.9 | 17,641.9 | 21,126.6 |
| Accounts Payable, % | 16.15 | 11.8 | 16.21 | 15.54 | 25.14 | 16.97 | 16.97 | 16.97 | 16.97 | 16.97 |
| Capital Expenditure | -977.2 | -676.1 | -3,388.4 | -2,325.3 | -15,588.0 | -5,860.0 | -7,017.6 | -8,403.7 | -10,063.7 | -12,051.5 |
| Capital Expenditure, % | -3.81 | -1.85 | -7.59 | -4.32 | -30.83 | -9.68 | -9.68 | -9.68 | -9.68 | -9.68 |
| Tax Rate, % | 25.75 | 25.75 | 25.75 | 25.75 | 25.75 | 25.75 | 25.75 | 25.75 | 25.75 | 25.75 |
| EBITAT | 3,067.9 | 4,658.5 | 6,053.8 | 6,675.9 | 6,829.6 | 7,769.9 | 9,304.6 | 11,142.5 | 13,343.5 | 15,979.2 |
| Depreciation | ||||||||||
| Changes in Account Receivables | ||||||||||
| Changes in Inventories | ||||||||||
| Changes in Accounts Payable | ||||||||||
| Capital Expenditure | ||||||||||
| UFCF | -7,507.8 | 3,701.4 | 775.9 | 8,494.9 | -8,612.6 | -1,903.6 | 571.4 | 684.3 | 819.5 | 981.3 |
| WACC, % | 4.72 | 4.67 | 4.68 | 4.64 | 4.68 | 4.68 | 4.68 | 4.68 | 4.68 | 4.68 |
| PV UFCF | ||||||||||
| SUM PV UFCF | 762.9 | |||||||||
| Long Term Growth Rate, % | 3.00 | |||||||||
| Free cash flow (T + 1) | 1,011 | |||||||||
| Terminal Value | 60,283 | |||||||||
| Present Terminal Value | 47,967 | |||||||||
| Enterprise Value | 48,730 | |||||||||
| Net Debt | 39,736 | |||||||||
| Equity Value | 8,994 | |||||||||
| Diluted Shares Outstanding, MM | 65 | |||||||||
| Equity Value Per Share | 137.99 |
What You Will Receive
- Genuine H.G. Infra Data: Preloaded financials – including revenue and EBIT – based on real and projected figures.
- Comprehensive Customization: Modify all essential parameters (yellow cells) such as WACC, growth %, and tax rates.
- Instant Valuation Refresh: Automatic recalculations to assess the effects of changes on H.G. Infra’s fair value.
- Flexible Excel Template: Designed for quick edits, scenario analysis, and detailed forecasting.
- Efficient and Accurate: Eliminate the need to build models from the ground up while ensuring precision and adaptability.
Key Features
- 🔍 Real-Life HGINFRANS Financials: Pre-filled historical and projected data for H.G. Infra Engineering Limited.
- ✏️ Fully Customizable Inputs: Adjust all critical parameters (yellow cells) such as WACC, growth %, and tax rates.
- 📊 Professional DCF Valuation: Built-in formulas calculate HGINFRANS's intrinsic value using the Discounted Cash Flow method.
- ⚡ Instant Results: Visualize HGINFRANS's valuation immediately after making adjustments.
- Scenario Analysis: Test and compare outcomes for various financial assumptions side-by-side.
How It Operates
- Download the Template: Gain immediate access to the Excel-based H.G. Infra Engineering Limited (HGINFRANS) DCF Calculator.
- Input Your Assumptions: Modify the yellow-highlighted cells for growth rates, WACC, profit margins, and other key metrics.
- Instant Calculations: The model will automatically refresh to reflect H.G. Infra Engineering's intrinsic value.
- Test Scenarios: Experiment with various assumptions to assess potential changes in valuation.
- Analyze and Decide: Utilize the outcomes to inform your investment decisions or financial analysis.
Why Choose H.G. Infra Engineering Limited (HGINFRANS)?
- Time-Efficient: No need to start from scratch – our tools are ready to go.
- Enhanced Accuracy: Dependable data and formulas minimize valuation errors.
- Completely Customizable: Adjust the model to match your specific assumptions and forecasts.
- Simple to Understand: Intuitive charts and outputs facilitate easy analysis of results.
- Endorsed by Professionals: Crafted for experts who prioritize precision and user-friendliness.
Who Can Benefit from H.G. Infra Engineering Limited (HGINFRANS)?
- Investors: Evaluate H.G. Infra Engineering's valuation prior to making stock purchases or sales.
- CFOs and Financial Analysts: Optimize valuation methodologies and assess financial forecasts.
- Startup Founders: Gain insights into how leading companies like H.G. Infra Engineering are valued.
- Consultants: Provide comprehensive valuation reports for your clients.
- Students and Educators: Utilize real-time data to practice and teach valuation strategies.
Contents of the H.G. Infra Engineering Limited (HGINFRANS) Template
- Comprehensive DCF Model: An editable template featuring in-depth valuation computations.
- Real-World Data: Historical and projected financial information for H.G. Infra Engineering Limited preloaded for analysis.
- Customizable Parameters: Modify WACC, growth rates, and tax assumptions to explore different scenarios.
- Financial Statements: Complete annual and quarterly breakdowns for enhanced insights.
- Key Ratios: Integrated analysis covering profitability, efficiency, and leverage metrics.
- Dashboard with Visual Outputs: Clear charts and tables designed for actionable results.
Disclaimer
All information, articles, and product details provided on this website are for general informational and educational purposes only. We do not claim any ownership over, nor do we intend to infringe upon, any trademarks, copyrights, logos, brand names, or other intellectual property mentioned or depicted on this site. Such intellectual property remains the property of its respective owners, and any references here are made solely for identification or informational purposes, without implying any affiliation, endorsement, or partnership.
We make no representations or warranties, express or implied, regarding the accuracy, completeness, or suitability of any content or products presented. Nothing on this website should be construed as legal, tax, investment, financial, medical, or other professional advice. In addition, no part of this site—including articles or product references—constitutes a solicitation, recommendation, endorsement, advertisement, or offer to buy or sell any securities, franchises, or other financial instruments, particularly in jurisdictions where such activity would be unlawful.
All content is of a general nature and may not address the specific circumstances of any individual or entity. It is not a substitute for professional advice or services. Any actions you take based on the information provided here are strictly at your own risk. You accept full responsibility for any decisions or outcomes arising from your use of this website and agree to release us from any liability in connection with your use of, or reliance upon, the content or products found herein.