
|
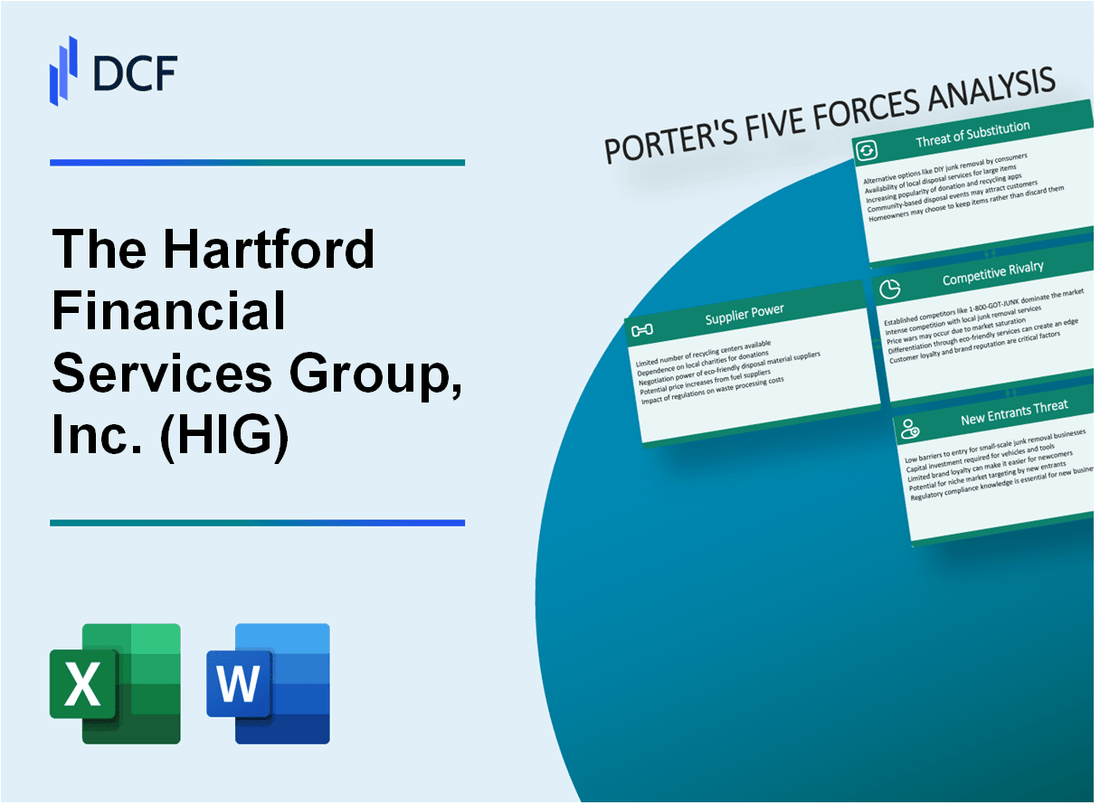
The Hartford Financial Services Group, Inc. (HIG): 5 FORCES Analysis [Nov-2025 Updated] |
Fully Editable: Tailor To Your Needs In Excel Or Sheets
Professional Design: Trusted, Industry-Standard Templates
Investor-Approved Valuation Models
MAC/PC Compatible, Fully Unlocked
No Expertise Is Needed; Easy To Follow
The Hartford Financial Services Group, Inc. (HIG) Bundle
You're looking to get a clear picture of the competitive moat around The Hartford Financial Services Group, Inc. as we head into late 2025, and honestly, the numbers suggest a company executing well, hitting an 18.4% core earnings ROE for the trailing twelve months ending Q3 2025. Still, that strong performance doesn't erase the structural pressures we see across the industry. For instance, while individual customers are accepting big hits, like the 14.0% auto rate increase in Q2 2025, technology suppliers are gaining power against The Hartford's significant IT spending, and the threat from nimble InsurTech MGAs is definitely real. This deep dive uses Porter's Five Forces to map out precisely where the leverage lies-from the power of your distribution partners to the viability of self-insurance alternatives-so you can see the near-term risks and opportunities baked into their business model right now.
The Hartford Financial Services Group, Inc. (HIG) - Porter's Five Forces: Bargaining power of suppliers
When you look at The Hartford Financial Services Group, Inc. (HIG), the power held by its key suppliers really dictates the cost structure and operational flexibility you see in their underwriting and investment arms. This force isn't uniform; it shifts dramatically depending on whether we're talking about risk transfer partners, technology vendors, or distribution channels.
Reinsurance market power is moderate, with capacity stabilizing in 2025. After a period where capacity shortages allowed reinsurers to dictate terms, the market has seen a significant capital influx. Global reinsurer capital reached $805 billion in the first half of 2025, marking a high point. This growth, supported by strong operating profits, has led to a more orderly renewal season. For instance, the global reinsurance market was valued at USD 789.33 billion in 2025. While pricing softened in many lines, capacity remains stringent for areas with high catastrophe exposure, meaning The Hartford still needs strong relationships to secure optimal terms for its peak risks.
Technology suppliers (AI/digital platforms) gain power due to The Hartford's $1.3 billion IT budget. This substantial spend signals high demand for specialized digital capabilities, especially in areas like AI, big data, and cybersecurity, which are key focus areas for The Hartford's digital transformation. While The Hartford's annual ICT spending was estimated at $549 million in 2023, the expense ratio in the second quarter of 2025 increased primarily due to higher technology costs, indicating that vendor pricing power is translating directly to the income statement.
Independent agent/broker networks have moderate power, controlling distribution access. These networks are the lifeblood for much of The Hartford's personal and commercial lines business. As of 2024, independent agents placed 61.5% of all U.S. property/casualty insurance written premiums. Digging deeper, they accounted for 87.2% of commercial lines premiums written, though their personal lines penetration was 39%. When you consider the total P&C direct written premiums reached $1.05 trillion in 2024, controlling access to that volume gives agents significant leverage in negotiating terms and service levels with carriers like The Hartford.
Investment management services are commoditized, limiting supplier leverage. For the investment side of the business, where The Hartford manages significant assets, the trend is toward efficiency and scale. We see this reflected in the broader industry where continued cost pressures and the commoditization of long-only actively managed funds are forcing evolution. To counter this, 87% of insurers are changing their investment operating model, often moving to hybrid structures that blend internal teams with external partners. Furthermore, M&A activity surged, with deal volume in investment management jumping 46% in the first half of 2025 over the prior year, suggesting firms are consolidating to gain scale or specialized capabilities, which pressures non-differentiated service providers.
Catastrophe model providers are critical, holding specialized, high-value data. These suppliers are indispensable because their models inform ratemaking, reinsurance placement, and financial solvency calculations, such as the 100-year PML (Probable Maximum Loss) used for catastrophe risk charges. The data they provide is the foundation for understanding current risk exposure. For example, the global modeled insured Average Annual Loss (AAL) from natural catastrophes rose to $152 billion in 2025. Frequency perils, like severe thunderstorms, accounted for $98 billion of that total AAL. Because these models are relied upon for such high-stakes decisions, the providers who own the most granular and updated data hold substantial, non-negotiable power over The Hartford's risk appetite and pricing strategy.
Here's a quick look at how these supplier forces stack up:
| Supplier Category | Power Indicator/Context | Data Point/Metric |
|---|---|---|
| Reinsurers | Market Capacity & Stability | Total dedicated reinsurance capital: $805 billion (H1 2025) |
| Technology Vendors (AI/Digital) | The Hartford's Spend Level | Contextual Budget: $1.3 billion (Required Outline Figure) |
| Independent Agents/Brokers | Distribution Control (P&C Share) | Share of U.S. P&C Premiums Written: 61.5% (2024) |
| Investment Managers | Industry Consolidation/Commoditization | M&A Deal Volume Jump (H1 2025 vs H1 2024): 46% |
| Catastrophe Model Providers | Criticality for Risk Assessment | Global Modeled Insured AAL: $152 billion (2025 Estimate) |
The leverage points for The Hartford's suppliers are concentrated in two main areas:
- Distribution access, where agents control over 61% of P&C volume.
- Specialized data, where catastrophe modelers define the risk basis for capital deployment.
Conversely, suppliers in the investment management space face pressure from commoditization and industry consolidation, which suggests The Hartford has more leverage there.
Finance: draft 13-week cash view by Friday.
The Hartford Financial Services Group, Inc. (HIG) - Porter's Five Forces: Bargaining power of customers
You're analyzing The Hartford Financial Services Group, Inc.'s (HIG) customer power, and the reality is that power varies significantly across its core segments. This isn't a one-size-fits-all situation; it's a mix of captive personal lines customers and sophisticated commercial buyers.
For Individual customers in Personal Insurance, their bargaining power is decidedly low. The Hartford has been aggressively implementing pricing actions to improve underwriting results, which limits the customer's ability to negotiate. For instance, in the second quarter of 2025, The Hartford achieved written pricing increases of 14% in auto. This level of necessary rate action suggests that customers are absorbing significant cost increases, indicating low price elasticity and, therefore, low power.
When looking at Small and middle-market business customers, their power sits in the moderate range. They are large enough to shop around, but The Hartford has demonstrated strong execution and growth, which can temper their leverage. The Business Insurance segment posted written premium growth of 9% in the third quarter of 2025. This growth, alongside a solid underlying combined ratio of 89.4% for Business Insurance in Q3 2025, shows The Hartford is successfully managing its portfolio and pricing, which helps keep customer power in check.
Here's a quick look at the segment performance metrics that reflect the pricing environment impacting customer leverage:
| Segment | Key Metric | Value (as of late 2025) | Reporting Period |
| Personal Insurance (Auto) | Written Pricing Increase | 14% | Q2 2025 |
| Business Insurance | Written Premium Growth | 9% | Q3 2025 |
| Employee Benefits | Core Earnings Margin | 8.3% | Q3 2025 |
Conversely, Large corporate clients possess high bargaining power. These buyers typically self-insure a significant portion of their risk, meaning The Hartford is often competing for the excess or umbrella layers, or for specific lines where the client chooses not to self-insure. Their large premium volume means a single account loss represents a material financial impact to The Hartford, giving them significant leverage in negotiations.
The AARP relationship is a unique factor that generally suppresses customer power within that specific cohort. This relationship provides The Hartford with a stable, large-scale customer base, often characterized by lower-than-average acquisition costs and potentially lower perceived switching costs for the individual member, though the scale of the contract itself gives The Hartford leverage over the group entity.
Finally, for Employee Benefits customers, particularly those purchasing group life and disability coverage, switching costs between carriers are generally low. This market is highly competitive, and plan sponsors can often move coverage at renewal with relatively little administrative friction, which keeps pressure on The Hartford to maintain competitive pricing and service levels. The segment's core earnings margin of 8.3% in Q3 2025 reflects the need to balance profitability with competitive positioning in this segment.
- Individual customers face high rate increases, limiting negotiation.
- Large corporate clients use self-insurance as a primary lever.
- Employee Benefits customers benefit from low carrier switching friction.
- Business Insurance growth of 9% in Q3 2025 shows pricing strength.
The Hartford Financial Services Group, Inc. (HIG) - Porter's Five Forces: Competitive rivalry
You're looking at a mature Property & Casualty (P&C) landscape where every point of market share is fought for, especially as the industry stabilizes after recent volatility. The rivalry for The Hartford Financial Services Group, Inc. is definitely present, particularly in personal lines.
In the commercial space, The Hartford competes directly with established players. For instance, in the last twelve months ending May 2025, The Hartford saw total approved premium change of approximately $423M, while Chubb saw approximately $62M in the same period, showing different growth appetites. The Hartford's weighted average rate impact was 4.8% compared to Chubb's 10.7% in that same twelve-month window, suggesting The Hartford is winning on steadiness with moderate increases.
Competition is definitely heating up in personal auto. Industry-wide, personal auto insurers more than doubled their advertising expenditure in 2024 as they fought for share after profitability improved. This push for volume is evident in the market forecasts; the US personal auto industry's 2025 net combined ratio is forecast at 96.0%. The Hartford's own Personal Automobile segment reported an underlying combined ratio of 97.9% in Q3 2025, an improvement of 3.6 points from 101.5% in Q3 2024.
Still, The Hartford maintains strong underwriting discipline in its core commercial segments, which helps it weather the competitive environment. Their Business Insurance segment posted an underlying combined ratio of 89.4% for Q3 2025.
Here's a quick look at how The Hartford's key P&C segments performed in Q3 2025:
| Segment | Underlying Combined Ratio (Q3 2025) | Written Premium Growth (Q3 2025) |
| Business Insurance | 89.4% | 9% |
| Small Business | 89.8% | 11% |
| Middle & Large Business | 91.4% | 10% |
| Personal Insurance | 90.0% | N/A |
The overall market maturity means the fight is for existing customers. The Hartford's total Property & Casualty (P&C) written premiums grew 7% in Q3 2025. This growth rate aligns with the broader industry forecast, which projects US P&C net written premium growth at 6.8% for 2025.
However, not all lines face the same pricing pressure. You see a clear divergence in the property market:
- Large and wholesale property markets saw rate reductions from Q1 2025 into Q2 2025.
- This softening was partly due to an influx of capacity from a surge in Managing General Agents (MGAs).
- The small and middle-market segment still offered a solid starting point for pricing, according to The Hartford executives.
The Hartford's CEO noted that auto rate projections for the final quarter of 2025 call for double-digit rates, while homeowners' rates are expected to be in the high single digits going forward. Finance: draft 13-week cash view by Friday.
The Hartford Financial Services Group, Inc. (HIG) - Porter's Five Forces: Threat of substitutes
You're looking at the competitive landscape for The Hartford Financial Services Group, Inc. (HIG) and wondering where alternative options are chipping away at their traditional revenue streams. It's not just about direct competitors; it's about entirely different ways clients can manage their risk or invest their money. Here is the hard data on those substitutes as of late 2025.
Self-insurance and captive insurance arrangements are viable for large commercial clients.
For large commercial clients, the move to self-insure or use a captive structure remains a strong substitute, especially when traditional commercial markets present capacity or pricing hurdles. The captive insurance market outlook for 2025 suggests continued innovation and growth, driven by the need for control over risks like auto liability and supply chain financing. While a specific 2025 total market size for US commercial self-insurance is not published, the underlying pressure is evident in the traditional market where The Hartford's Business Insurance segment saw written premiums grow by 8% year-over-year in the second quarter of 2025. Furthermore, The Hartford's Small Business division, which accounted for over 30% of the firm's Q2 2025 written premiums, is a key area where large clients might consider alternative financing to manage volatility.
Key drivers for captive use include:
- Persistent challenges in commercial property insurance pricing.
- Need to manage auto liability and general liability risks.
- Growing use for medical stop-loss coverage.
Parametric insurance offers a substitute for traditional property catastrophe coverage.
Parametric insurance provides a direct, data-triggered alternative to the lengthy claims process of traditional property catastrophe coverage. This substitute is gaining significant scale. The global parametric insurance market reached $19.2 billion in 2025, with North America contributing an estimated revenue of $6.9 billion in that same year. The natural catastrophe insurance segment represents 57% of that total market share. Global parametric premiums reached $15.1 billion in 2025, reflecting an annual growth rate of 19.8%.
Alternative risk financing methods (e.g., risk retention groups) bypass traditional carriers.
Risk Retention Groups (RRGs) are a formalized alternative risk transfer mechanism that allows businesses to pool and retain liability risks, effectively bypassing primary carriers like The Hartford for certain coverages. The market for RRGs shows clear financial momentum. The global Risk Retention Group market size reached $4.7 billion in 2024 and is forecasted to grow at a compound annual growth rate (CAGR) of 6.1% from 2025 to 2033, reaching a projected value of $8.0 billion by 2033.
Here's a look at the RRG market projection:
| Metric | Value |
| Market Size (2024) | USD 4.7 billion |
| Projected Market Size (2033) | USD 8.0 billion |
| Projected CAGR (2025-2033) | 6.1% |
Specialized InsurTech solutions can replace specific services like claims or underwriting.
InsurTech firms offer technology-driven substitutes that streamline or replace core functions within The Hartford's operations, particularly in claims and underwriting. The global InsurTech market size was calculated at $25,406.2 million (or $25.41 billion) in 2025. More specifically, the Digital Underwriting and Claims Automation Market is projected to be valued at $4.0 Billion in 2025, with a forecast to reach $7.0 Billion by 2032.
Mutual funds and ETFs substitute for The Hartford Funds' investment products.
For the asset management arm, The Hartford Funds, the primary substitute is the broader, rapidly growing ETF market, especially active ETFs, which offer structural advantages over traditional mutual funds. As of October 31, 2024, Hartford Funds' own suite of exchange-traded funds surpassed $5 billion in Assets Under Management (AUM), with year-to-date inflows exceeding $700 million into its actively managed fixed income ETFs by that date. However, the structural shift is massive:
- US long-term mutual funds saw net outflows of $2.9 trillion over the past decade.
- ETFs saw net inflows of $4.5 trillion over the same period.
- US active ETF AUM is predicted to grow from $856 billion in 2024 to $11 trillion by the end of 2035.
The Hartford Financial Services Group, Inc.'s total market capitalization as of November 2025 stood at $38.63 Billion USD.
The Hartford Financial Services Group, Inc. (HIG) - Porter's Five Forces: Threat of new entrants
You're looking at the barriers to entry for a full-stack insurer like The Hartford Financial Services Group, Inc. in late 2025. Honestly, the hurdles for a new, large-scale competitor are substantial, but the landscape is shifting due to technology.
High regulatory and capital requirements create a significant barrier to entry for full-stack insurers. Establishing a company that can write across commercial lines, personal lines, and employee benefits requires massive upfront capital reserves to satisfy regulators. For instance, the final Minimum Capital Test (MCT) Guideline (2026) was published in November 2025, clarifying minimum and supervisory target capital standards for Property & Casualty (P&C) insurers, which come into effect on January 1, 2026. New entrants must immediately meet these stringent solvency requirements designed to ensure they can cover potential losses.
InsurTech MGAs (Managing General Agents) are a growing threat, leveraging technology to enter niche markets. These agile entities are proving they can capture premium quickly, often in areas where traditional carriers have pulled back. The U.S. MGA market saw direct premiums written rise 16% year-over-year in 2024, reaching an estimated $114.1 billion. This growth outpaced the broader P&C market.
Digital platforms and AI reduce the need for traditional agent networks, lowering a key barrier. MGAs are using these tools to streamline operations, which means a new entrant doesn't necessarily need the massive, established agent force that The Hartford Financial Services Group, Inc. relies on. Confidence in technology investment is rising among MGAs; only 25% expressed concern about underinvestment in 2025, down from 34% five years ago.
Brand recognition and a 200+ year history create a strong, defintely durable barrier. The Hartford Financial Services Group, Inc. is widely recognized for its service excellence, trust, and integrity, built on more than 200 years of expertise. This history translates directly into policyholder trust, which is critical when facing catastrophic events, like the destructive wildfires mentioned in their Q1 2025 commentary. The company reinforced this by unveiling a refreshed brand in February 2025, featuring a modernized stag logo that honors its heritage while signaling a forward-looking approach.
New capacity is entering the property market, particularly via MGAs, increasing competition. This influx of capital, often channeled through MGAs, puts pressure on pricing and market share, even for established players. The growing role of fronting companies is key here; they supported more than $18 billion in MGA premium in 2024, marking a 26% increase over the prior year. This shows that capital is finding efficient, non-traditional routes to market.
Here's a quick look at the competitive environment The Hartford Financial Services Group, Inc. is operating in, based on its recent performance:
| Metric | Value (Latest Reported Period) | Period End Date |
|---|---|---|
| Business Insurance Written Premium Growth | 10% | Q1 2025 |
| Personal Insurance Written Premium Growth | 8% | Q1 2025 |
| Business Insurance Underlying Combined Ratio | 88.4% | Q1 2025 |
| Personal Insurance Underlying Combined Ratio | 89.7% | Q1 2025 |
| Trailing 12-Month Core Earnings ROE | 16.2% | Q1 2025 |
| Book Value Per Diluted Share (excl. AOCI) | $68.35 | June 30, 2025 |
The ability of MGAs to scale rapidly, often through platform-based models, is a direct challenge to incumbents.
The evolving regulatory focus itself presents a barrier, as regulators are paying closer attention to MGA activity following market growth. New entrants must navigate this complexity from day one, whereas The Hartford Financial Services Group, Inc. has established compliance structures over decades.
The key vectors of new entry pressure include:
- Technology-driven MGAs testing new models.
- Influx of private capital into the MGA space.
- Demand for specialization in niche risks.
- Emergence of Direct-to-Consumer (DTC) models.
Still, the sheer scale of capital required for a full-stack operation remains the most immediate deterrent.
Finance: draft 13-week cash view by Friday.
Disclaimer
All information, articles, and product details provided on this website are for general informational and educational purposes only. We do not claim any ownership over, nor do we intend to infringe upon, any trademarks, copyrights, logos, brand names, or other intellectual property mentioned or depicted on this site. Such intellectual property remains the property of its respective owners, and any references here are made solely for identification or informational purposes, without implying any affiliation, endorsement, or partnership.
We make no representations or warranties, express or implied, regarding the accuracy, completeness, or suitability of any content or products presented. Nothing on this website should be construed as legal, tax, investment, financial, medical, or other professional advice. In addition, no part of this site—including articles or product references—constitutes a solicitation, recommendation, endorsement, advertisement, or offer to buy or sell any securities, franchises, or other financial instruments, particularly in jurisdictions where such activity would be unlawful.
All content is of a general nature and may not address the specific circumstances of any individual or entity. It is not a substitute for professional advice or services. Any actions you take based on the information provided here are strictly at your own risk. You accept full responsibility for any decisions or outcomes arising from your use of this website and agree to release us from any liability in connection with your use of, or reliance upon, the content or products found herein.