
|
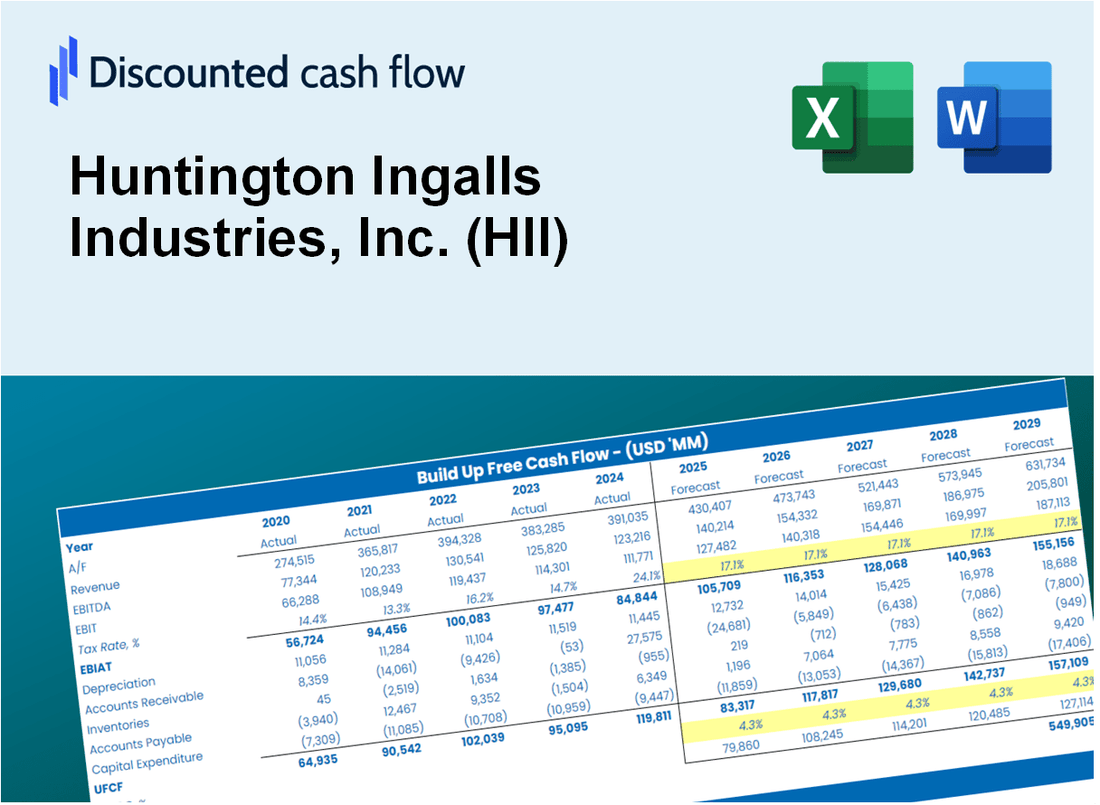
Huntington Ingalls Industries, Inc. (HII) DCF Valuation |
Fully Editable: Tailor To Your Needs In Excel Or Sheets
Professional Design: Trusted, Industry-Standard Templates
Investor-Approved Valuation Models
MAC/PC Compatible, Fully Unlocked
No Expertise Is Needed; Easy To Follow
Huntington Ingalls Industries, Inc. (HII) Bundle
Discover the true value of Huntington Ingalls Industries, Inc. (HII) with our advanced DCF Calculator! Adjust key assumptions, explore various scenarios, and evaluate how changes influence the valuation of Huntington Ingalls Industries, Inc. (HII) – all within one comprehensive Excel template.
What You Will Get
- Real HII Financials: Access to historical and projected data for precise valuation.
- Customizable Inputs: Adjust WACC, tax rates, revenue growth, and capital expenditures as needed.
- Dynamic Calculations: Intrinsic value and NPV are computed in real-time.
- Scenario Analysis: Evaluate various scenarios to assess Huntington Ingalls Industries’ future outlook.
- User-Friendly Design: Designed for industry professionals while remaining easy for newcomers to navigate.
Key Features
- Comprehensive Financial Data: Huntington Ingalls Industries' historical financial statements and pre-filled forecasts.
- Customizable Parameters: Modify WACC, tax rates, revenue growth, and EBITDA margins as needed.
- Real-Time Evaluation: Observe the intrinsic value of Huntington Ingalls Industries recalculating instantly.
- Intuitive Visual Representations: Dashboard charts present valuation results and essential metrics clearly.
- Designed for Precision: A professional-grade tool tailored for analysts, investors, and finance professionals.
How It Functions
- Download the Template: Gain immediate access to the Excel-based HII DCF Calculator.
- Input Your Assumptions: Modify the yellow-highlighted cells for growth rates, WACC, profit margins, and more.
- Instant Calculations: The model automatically computes Huntington Ingalls Industries' intrinsic value.
- Test Scenarios: Experiment with various assumptions to assess potential valuation shifts.
- Analyze and Decide: Utilize the outcomes to inform your investment or financial analysis.
Why Choose This Calculator for Huntington Ingalls Industries, Inc. (HII)?
- Accuracy: Utilizes reliable HII financial data for precise calculations.
- Flexibility: Allows users to easily adjust and experiment with inputs.
- Time-Saving: Eliminate the need to create a DCF model from the ground up.
- Professional-Grade: Crafted with the expertise and precision expected at the executive level.
- User-Friendly: Intuitive design makes it accessible for users of all financial backgrounds.
Who Should Use Huntington Ingalls Industries, Inc. (HII)?
- Investors: Gain insights into the defense and shipbuilding sectors with a reliable investment analysis tool.
- Financial Analysts: Streamline your evaluations with comprehensive financial models tailored for HII.
- Consultants: Easily modify reports and presentations to showcase HII's market position to clients.
- Industry Enthusiasts: Enhance your knowledge of the defense industry through detailed case studies and performance metrics.
- Educators and Students: Utilize HII as a case study in courses related to finance, engineering, and defense.
What the Template Contains
- Historical Data: Includes Huntington Ingalls Industries, Inc. (HII)’s past financials and baseline forecasts.
- DCF and Levered DCF Models: Detailed templates to calculate Huntington Ingalls Industries, Inc. (HII)’s intrinsic value.
- WACC Sheet: Pre-built calculations for Weighted Average Cost of Capital.
- Editable Inputs: Modify key drivers like growth rates, EBITDA %, and CAPEX assumptions.
- Quarterly and Annual Statements: A complete breakdown of Huntington Ingalls Industries, Inc. (HII)’s financials.
- Interactive Dashboard: Visualize valuation results and projections dynamically.
Disclaimer
All information, articles, and product details provided on this website are for general informational and educational purposes only. We do not claim any ownership over, nor do we intend to infringe upon, any trademarks, copyrights, logos, brand names, or other intellectual property mentioned or depicted on this site. Such intellectual property remains the property of its respective owners, and any references here are made solely for identification or informational purposes, without implying any affiliation, endorsement, or partnership.
We make no representations or warranties, express or implied, regarding the accuracy, completeness, or suitability of any content or products presented. Nothing on this website should be construed as legal, tax, investment, financial, medical, or other professional advice. In addition, no part of this site—including articles or product references—constitutes a solicitation, recommendation, endorsement, advertisement, or offer to buy or sell any securities, franchises, or other financial instruments, particularly in jurisdictions where such activity would be unlawful.
All content is of a general nature and may not address the specific circumstances of any individual or entity. It is not a substitute for professional advice or services. Any actions you take based on the information provided here are strictly at your own risk. You accept full responsibility for any decisions or outcomes arising from your use of this website and agree to release us from any liability in connection with your use of, or reliance upon, the content or products found herein.