
|
Hill & Smith Holdings PLC (HILS.L) DCF Valuation |
Fully Editable: Tailor To Your Needs In Excel Or Sheets
Professional Design: Trusted, Industry-Standard Templates
Investor-Approved Valuation Models
MAC/PC Compatible, Fully Unlocked
No Expertise Is Needed; Easy To Follow
Hill & Smith Holdings PLC (HILS.L) Bundle
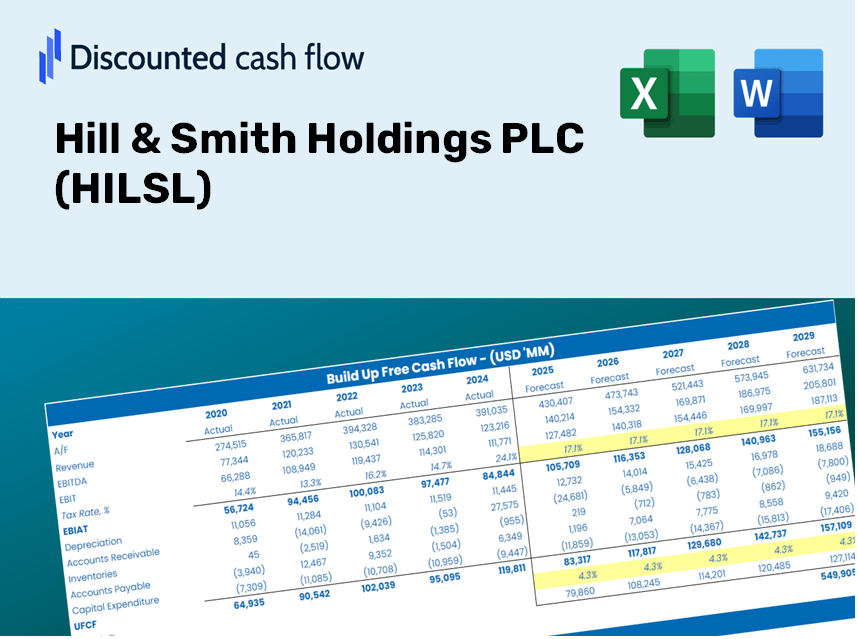
Gain insight into your Hill & Smith Holdings PLC (HILSL) valuation analysis using our state-of-the-art DCF Calculator! This Excel template comes preloaded with real (HILSL) data, enabling you to adjust forecasts and assumptions for an accurate calculation of Hill & Smith Holdings PLC's intrinsic value.
Discounted Cash Flow (DCF) - (USD MM)
| Year | AY1 2020 |
AY2 2021 |
AY3 2022 |
AY4 2023 |
AY5 2024 |
FY1 2025 |
FY2 2026 |
FY3 2027 |
FY4 2028 |
FY5 2029 |
|---|---|---|---|---|---|---|---|---|---|---|
| Revenue | 660.5 | 625.2 | 732.1 | 829.8 | 855.1 | 915.3 | 979.7 | 1,048.6 | 1,122.4 | 1,201.4 |
| Revenue Growth, % | 0 | -5.34 | 17.1 | 13.35 | 3.05 | 7.04 | 7.04 | 7.04 | 7.04 | 7.04 |
| EBITDA | 82.1 | 82.1 | 110.2 | 142.0 | 158.1 | 139.5 | 149.3 | 159.8 | 171.1 | 183.1 |
| EBITDA, % | 12.43 | 13.13 | 15.05 | 17.11 | 18.49 | 15.24 | 15.24 | 15.24 | 15.24 | 15.24 |
| Depreciation | 39.8 | 33.6 | 33.7 | 38.6 | 42.3 | 46.9 | 50.2 | 53.7 | 57.5 | 61.5 |
| Depreciation, % | 6.03 | 5.37 | 4.6 | 4.65 | 4.95 | 5.12 | 5.12 | 5.12 | 5.12 | 5.12 |
| EBIT | 42.3 | 48.5 | 76.5 | 103.4 | 115.8 | 92.7 | 99.2 | 106.2 | 113.6 | 121.6 |
| EBIT, % | 6.4 | 7.76 | 10.45 | 12.46 | 13.54 | 10.12 | 10.12 | 10.12 | 10.12 | 10.12 |
| Total Cash | 22.0 | 18.8 | 24.8 | 34.4 | 55.0 | 37.2 | 39.8 | 42.6 | 45.6 | 48.8 |
| Total Cash, percent | .0 | .0 | .0 | .0 | .0 | .0 | .0 | .0 | .0 | .0 |
| Account Receivables | 124.0 | 123.6 | 138.8 | 130.2 | 155.3 | 167.2 | 179.0 | 191.6 | 205.1 | 219.5 |
| Account Receivables, % | 18.77 | 19.77 | 18.96 | 15.69 | 18.16 | 18.27 | 18.27 | 18.27 | 18.27 | 18.27 |
| Inventories | 96.3 | 108.1 | 113.8 | 106.1 | 100.1 | 131.6 | 140.9 | 150.8 | 161.4 | 172.8 |
| Inventories, % | 14.58 | 17.29 | 15.54 | 12.79 | 11.71 | 14.38 | 14.38 | 14.38 | 14.38 | 14.38 |
| Accounts Payable | 62.7 | 79.3 | 67.8 | 53.4 | 61.5 | 82.5 | 88.3 | 94.5 | 101.2 | 108.3 |
| Accounts Payable, % | 9.49 | 12.68 | 9.26 | 6.44 | 7.19 | 9.01 | 9.01 | 9.01 | 9.01 | 9.01 |
| Capital Expenditure | -17.3 | -19.2 | -20.9 | -29.5 | -21.3 | -26.7 | -28.6 | -30.6 | -32.8 | -35.1 |
| Capital Expenditure, % | -2.62 | -3.07 | -2.85 | -3.56 | -2.49 | -2.92 | -2.92 | -2.92 | -2.92 | -2.92 |
| Tax Rate, % | 26.89 | 26.89 | 26.89 | 26.89 | 26.89 | 26.89 | 26.89 | 26.89 | 26.89 | 26.89 |
| EBITAT | 28.6 | 38.8 | 62.6 | 76.3 | 84.7 | 69.7 | 74.6 | 79.9 | 85.5 | 91.5 |
| Depreciation | ||||||||||
| Changes in Account Receivables | ||||||||||
| Changes in Inventories | ||||||||||
| Changes in Accounts Payable | ||||||||||
| Capital Expenditure | ||||||||||
| UFCF | -106.5 | 58.4 | 43.0 | 87.3 | 94.7 | 67.4 | 81.0 | 86.7 | 92.8 | 99.3 |
| WACC, % | 8.73 | 8.8 | 8.81 | 8.76 | 8.76 | 8.77 | 8.77 | 8.77 | 8.77 | 8.77 |
| PV UFCF | ||||||||||
| SUM PV UFCF | 329.3 | |||||||||
| Long Term Growth Rate, % | 2.00 | |||||||||
| Free cash flow (T + 1) | 101 | |||||||||
| Terminal Value | 1,496 | |||||||||
| Present Terminal Value | 983 | |||||||||
| Enterprise Value | 1,312 | |||||||||
| Net Debt | 91 | |||||||||
| Equity Value | 1,222 | |||||||||
| Diluted Shares Outstanding, MM | 81 | |||||||||
| Equity Value Per Share | 1,500.71 |
What You Will Receive
- Authentic Hill & Smith Data: Preloaded financials – covering everything from revenue to EBIT – based on actual and projected figures.
- Complete Customization: Modify all essential parameters (yellow cells) such as WACC, growth %, and tax rates.
- Instant Valuation Updates: Automatic recalculations to assess the impact of changes on Hill & Smith’s fair value.
- Flexible Excel Template: Designed for quick modifications, scenario analysis, and comprehensive projections.
- Efficient and Precise: Eliminate the need to build models from the ground up while ensuring accuracy and adaptability.
Core Benefits
- Accurate Hill & Smith Financial Data: Gain access to reliable pre-loaded historical figures and future forecasts.
- Adjustable Forecast Parameters: Modify the highlighted fields such as WACC, growth rates, and profit margins.
- Real-Time Calculations: Automatic updates for DCF, Net Present Value (NPV), and cash flow assessments.
- User-Friendly Dashboard: Clear charts and summaries to help you visualize your valuation findings.
- Suitable for All Levels: A straightforward and intuitive design tailored for investors, CFOs, and consultants alike.
How It Works
- Step 1: Download the prebuilt Excel template with Hill & Smith Holdings PLC's data included.
- Step 2: Explore the pre-filled sheets and familiarize yourself with the key metrics.
- Step 3: Update forecasts and assumptions in the editable yellow cells (WACC, growth, margins).
- Step 4: Instantly view recalculated results, including Hill & Smith Holdings PLC's intrinsic value.
- Step 5: Make informed investment decisions or generate reports based on the outputs.
Why Choose This Calculator for Hill & Smith Holdings PLC (HILSL)?
- Precision: Utilizes accurate financial data from Hill & Smith Holdings PLC (HILSL) for reliable results.
- Adaptability: Allows users to adjust and experiment with inputs as desired.
- Efficiency: Avoid the complexities of creating a DCF model from the ground up.
- Expert-Level: Crafted with attention to detail suitable for CFOs and financial professionals.
- Intuitive Interface: Simple and accessible, even for those new to financial modeling.
Who Can Benefit from This Product?
- Institutional Investors: Create comprehensive and trustworthy valuation models for analyzing portfolio performance.
- Corporate Finance Departments: Evaluate valuation scenarios to inform strategic decisions within the organization.
- Consultants and Financial Advisors: Deliver precise valuation insights for Hill & Smith Holdings PLC (HILSL) to clients.
- Students and Educators: Utilize real data to practice and teach financial modeling concepts.
- Industry Analysts: Gain insights into the valuation methodologies of companies like Hill & Smith Holdings PLC (HILSL).
Contents of the Template
- Pre-Filled DCF Model: Hill & Smith Holdings PLC’s financial data preloaded for immediate use.
- WACC Calculator: Comprehensive calculations for Weighted Average Cost of Capital.
- Financial Ratios: Assess Hill & Smith's profitability, leverage, and efficiency.
- Editable Inputs: Modify assumptions such as growth rates, profit margins, and CAPEX to suit your scenarios.
- Financial Statements: Annual and quarterly reports to facilitate in-depth analysis.
- Interactive Dashboard: Effortlessly visualize essential valuation metrics and outcomes.
Disclaimer
All information, articles, and product details provided on this website are for general informational and educational purposes only. We do not claim any ownership over, nor do we intend to infringe upon, any trademarks, copyrights, logos, brand names, or other intellectual property mentioned or depicted on this site. Such intellectual property remains the property of its respective owners, and any references here are made solely for identification or informational purposes, without implying any affiliation, endorsement, or partnership.
We make no representations or warranties, express or implied, regarding the accuracy, completeness, or suitability of any content or products presented. Nothing on this website should be construed as legal, tax, investment, financial, medical, or other professional advice. In addition, no part of this site—including articles or product references—constitutes a solicitation, recommendation, endorsement, advertisement, or offer to buy or sell any securities, franchises, or other financial instruments, particularly in jurisdictions where such activity would be unlawful.
All content is of a general nature and may not address the specific circumstances of any individual or entity. It is not a substitute for professional advice or services. Any actions you take based on the information provided here are strictly at your own risk. You accept full responsibility for any decisions or outcomes arising from your use of this website and agree to release us from any liability in connection with your use of, or reliance upon, the content or products found herein.