
|
Hindustan Copper Limited (HINDCOPPER.NS) DCF Valuation |
Fully Editable: Tailor To Your Needs In Excel Or Sheets
Professional Design: Trusted, Industry-Standard Templates
Investor-Approved Valuation Models
MAC/PC Compatible, Fully Unlocked
No Expertise Is Needed; Easy To Follow
Hindustan Copper Limited (HINDCOPPER.NS) Bundle
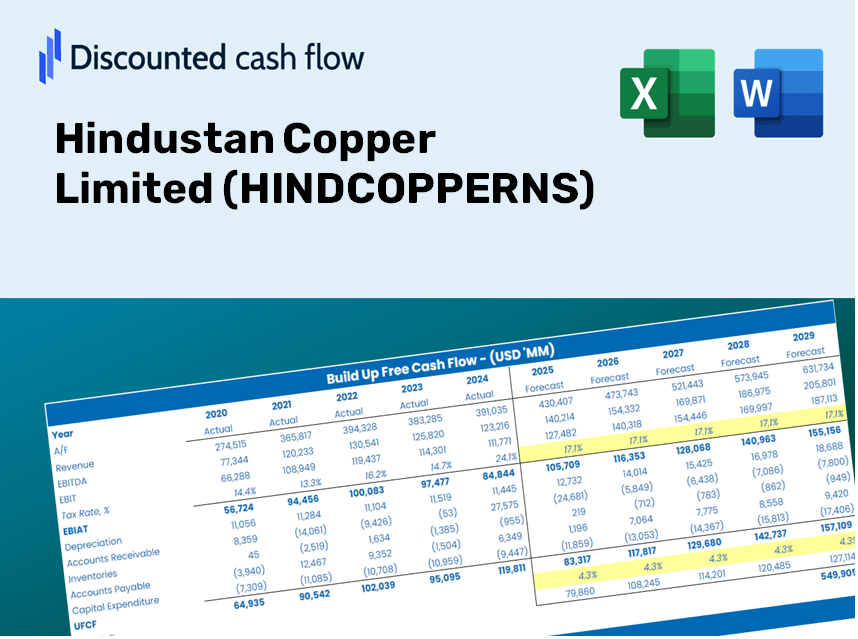
Gain insight into your Hindustan Copper Limited (HINDCOPPERNS) valuation analysis using our sophisticated DCF Calculator! This Excel template comes preloaded with real (HINDCOPPERNS) data, enabling you to adjust forecasts and assumptions for an accurate calculation of Hindustan Copper Limited's intrinsic value.
Discounted Cash Flow (DCF) - (USD MM)
| Year | AY1 2021 |
AY2 2022 |
AY3 2023 |
AY4 2024 |
AY5 2025 |
FY1 2026 |
FY2 2027 |
FY3 2028 |
FY4 2029 |
FY5 2030 |
|---|---|---|---|---|---|---|---|---|---|---|
| Revenue | 17,867.6 | 18,038.7 | 16,651.4 | 17,170.0 | 20,709.6 | 21,589.6 | 22,506.9 | 23,463.3 | 24,460.3 | 25,499.6 |
| Revenue Growth, % | 0 | 0.95731 | -7.69 | 3.11 | 20.62 | 4.25 | 4.25 | 4.25 | 4.25 | 4.25 |
| EBITDA | 4,469.6 | 5,358.3 | 5,781.3 | 5,945.0 | 8,148.9 | 7,056.0 | 7,355.8 | 7,668.4 | 7,994.2 | 8,333.9 |
| EBITDA, % | 25.02 | 29.7 | 34.72 | 34.62 | 39.35 | 32.68 | 32.68 | 32.68 | 32.68 | 32.68 |
| Depreciation | 2,955.8 | 1,483.1 | 1,749.3 | 1,748.7 | 1,755.6 | 2,328.7 | 2,427.7 | 2,530.8 | 2,638.4 | 2,750.5 |
| Depreciation, % | 16.54 | 8.22 | 10.51 | 10.18 | 8.48 | 10.79 | 10.79 | 10.79 | 10.79 | 10.79 |
| EBIT | 1,513.8 | 3,875.2 | 4,032.0 | 4,196.3 | 6,393.3 | 4,727.3 | 4,928.1 | 5,137.6 | 5,355.9 | 5,583.4 |
| EBIT, % | 8.47 | 21.48 | 24.21 | 24.44 | 30.87 | 21.9 | 21.9 | 21.9 | 21.9 | 21.9 |
| Total Cash | 107.8 | 3,656.0 | 3,007.8 | 740.5 | 677.7 | 2,008.7 | 2,094.0 | 2,183.0 | 2,275.8 | 2,372.5 |
| Total Cash, percent | .0 | .0 | .0 | .0 | .0 | .0 | .0 | .0 | .0 | .0 |
| Account Receivables | 1,677.8 | 801.0 | 661.5 | 1,368.1 | 1,705.6 | 1,468.4 | 1,530.8 | 1,595.8 | 1,663.6 | 1,734.3 |
| Account Receivables, % | 9.39 | 4.44 | 3.97 | 7.97 | 8.24 | 6.8 | 6.8 | 6.8 | 6.8 | 6.8 |
| Inventories | 1,760.0 | 1,130.0 | 1,165.3 | 2,282.7 | 3,214.5 | 2,242.3 | 2,337.6 | 2,436.9 | 2,540.4 | 2,648.4 |
| Inventories, % | 9.85 | 6.26 | 7 | 13.29 | 15.52 | 10.39 | 10.39 | 10.39 | 10.39 | 10.39 |
| Accounts Payable | 1,364.8 | 2,026.8 | 2,109.8 | 954.3 | 1,160.1 | 1,843.9 | 1,922.3 | 2,004.0 | 2,089.1 | 2,177.9 |
| Accounts Payable, % | 7.64 | 11.24 | 12.67 | 5.56 | 5.6 | 8.54 | 8.54 | 8.54 | 8.54 | 8.54 |
| Capital Expenditure | -3,664.0 | -4,204.5 | -3,473.2 | -4,852.6 | -1,783.0 | -4,384.6 | -4,570.9 | -4,765.1 | -4,967.6 | -5,178.7 |
| Capital Expenditure, % | -20.51 | -23.31 | -20.86 | -28.26 | -8.61 | -20.31 | -20.31 | -20.31 | -20.31 | -20.31 |
| Tax Rate, % | 26.45 | 26.45 | 26.45 | 26.45 | 26.45 | 26.45 | 26.45 | 26.45 | 26.45 | 26.45 |
| EBITAT | 1,907.8 | 3,791.2 | 3,010.8 | 3,016.9 | 4,702.2 | 3,951.5 | 4,119.4 | 4,294.5 | 4,476.9 | 4,667.2 |
| Depreciation | ||||||||||
| Changes in Account Receivables | ||||||||||
| Changes in Inventories | ||||||||||
| Changes in Accounts Payable | ||||||||||
| Capital Expenditure | ||||||||||
| UFCF | -873.4 | 3,238.6 | 1,474.1 | -3,066.6 | 3,611.3 | 3,788.9 | 1,896.8 | 1,977.4 | 2,061.5 | 2,149.1 |
| WACC, % | 11.93 | 11.93 | 11.92 | 11.92 | 11.92 | 11.92 | 11.92 | 11.92 | 11.92 | 11.92 |
| PV UFCF | ||||||||||
| SUM PV UFCF | 8,847.1 | |||||||||
| Long Term Growth Rate, % | 4.00 | |||||||||
| Free cash flow (T + 1) | 2,235 | |||||||||
| Terminal Value | 28,206 | |||||||||
| Present Terminal Value | 16,059 | |||||||||
| Enterprise Value | 24,906 | |||||||||
| Net Debt | 984 | |||||||||
| Equity Value | 23,922 | |||||||||
| Diluted Shares Outstanding, MM | 967 | |||||||||
| Equity Value Per Share | 24.73 |
What You Will Receive
- Customizable Forecast Parameters: Easily adjust key assumptions (growth %, margins, WACC) to explore various scenarios.
- Comprehensive Financial Data: Hindustan Copper Limited’s financial information pre-loaded to facilitate your analysis.
- Automated DCF Calculations: The template computes Net Present Value (NPV) and intrinsic value automatically.
- Sleek and Adaptable Design: A professional Excel model tailored to meet your valuation requirements.
- Designed for Analysts and Investors: Perfect for evaluating projections, confirming strategies, and optimizing efficiency.
Key Features
- Comprehensive DCF Calculator: Offers in-depth unlevered and levered DCF valuation frameworks.
- WACC Calculator: Ready-to-use Weighted Average Cost of Capital template with adjustable parameters.
- Customizable Forecast Inputs: Alter growth projections, capital expenditures, and discount rates as needed.
- Integrated Financial Ratios: Evaluate profitability, leverage, and efficiency ratios specifically for Hindustan Copper Limited (HINDCOPPERNS).
- Interactive Dashboard and Charts: Visual representations that encapsulate essential valuation metrics for straightforward analysis.
How It Functions
- Download: Obtain the pre-formatted Excel file containing Hindustan Copper Limited’s (HINDCOPPERNS) financial data.
- Customize: Modify forecasts such as revenue growth, EBITDA percentage, and WACC to fit your analysis.
- Update Automatically: Real-time updates for intrinsic value and NPV calculations as you make changes.
- Test Scenarios: Generate various projections and instantly compare results.
- Make Decisions: Utilize the valuation insights to shape your investment strategy.
Why Choose Hindustan Copper Limited (HINDCOPPERNS)?
- Time-Efficient: Skip the hassle of building a financial model from the ground up – it's already available for you.
- Enhanced Precision: Dependable financial data and calculations minimize valuation errors.
- Completely Customizable: Adjust the model to align with your specific assumptions and forecasts.
- User-Friendly: Intuitive charts and results make analysis straightforward.
- Endorsed by Professionals: Crafted for those in the industry who prioritize accuracy and ease of use.
Who Should Consider This Product?
- Professional Investors: Create comprehensive and trustworthy valuation models for assessing portfolios related to Hindustan Copper Limited (HINDCOPPERNS).
- Corporate Finance Teams: Evaluate valuation scenarios to inform strategic decisions within the organization.
- Consultants and Advisors: Deliver precise valuation insights to clients interested in Hindustan Copper Limited (HINDCOPPERNS).
- Students and Educators: Leverage real-world data for practice and instruction in financial modeling focused on copper mining.
- Mining Industry Enthusiasts: Gain insights into how companies like Hindustan Copper Limited (HINDCOPPERNS) are valued in the market landscape.
Contents of the Template
- Operating and Balance Sheet Data: Pre-filled historical data and forecasts for Hindustan Copper Limited (HINDCOPPERNS), including revenue, EBITDA, EBIT, and capital expenditures.
- WACC Calculation: A specific sheet dedicated to the Weighted Average Cost of Capital (WACC), featuring parameters such as Beta, risk-free rate, and share price.
- DCF Valuation (Unlevered and Levered): Customizable Discounted Cash Flow models that present intrinsic value along with comprehensive calculations.
- Financial Statements: Pre-loaded annual and quarterly financial statements to facilitate analysis.
- Key Ratios: Consists of profitability, leverage, and efficiency ratios specific to Hindustan Copper Limited (HINDCOPPERNS).
- Dashboard and Charts: A visual summary of valuation outputs and underlying assumptions for straightforward results analysis.
Disclaimer
All information, articles, and product details provided on this website are for general informational and educational purposes only. We do not claim any ownership over, nor do we intend to infringe upon, any trademarks, copyrights, logos, brand names, or other intellectual property mentioned or depicted on this site. Such intellectual property remains the property of its respective owners, and any references here are made solely for identification or informational purposes, without implying any affiliation, endorsement, or partnership.
We make no representations or warranties, express or implied, regarding the accuracy, completeness, or suitability of any content or products presented. Nothing on this website should be construed as legal, tax, investment, financial, medical, or other professional advice. In addition, no part of this site—including articles or product references—constitutes a solicitation, recommendation, endorsement, advertisement, or offer to buy or sell any securities, franchises, or other financial instruments, particularly in jurisdictions where such activity would be unlawful.
All content is of a general nature and may not address the specific circumstances of any individual or entity. It is not a substitute for professional advice or services. Any actions you take based on the information provided here are strictly at your own risk. You accept full responsibility for any decisions or outcomes arising from your use of this website and agree to release us from any liability in connection with your use of, or reliance upon, the content or products found herein.