
|
Hindustan Zinc Limited (HINDZINC.NS) DCF Valuation |
Fully Editable: Tailor To Your Needs In Excel Or Sheets
Professional Design: Trusted, Industry-Standard Templates
Investor-Approved Valuation Models
MAC/PC Compatible, Fully Unlocked
No Expertise Is Needed; Easy To Follow
Hindustan Zinc Limited (HINDZINC.NS) Bundle
Looking to assess the intrinsic value of Hindustan Zinc Limited? Our (HINDZINCNS) DCF Calculator integrates real-world data with extensive customization options, enabling you to refine your forecasts and enhance your investment decisions.
Discounted Cash Flow (DCF) - (USD MM)
| Year | AY1 2021 |
AY2 2022 |
AY3 2023 |
AY4 2024 |
AY5 2025 |
FY1 2026 |
FY2 2027 |
FY3 2028 |
FY4 2029 |
FY5 2030 |
|---|---|---|---|---|---|---|---|---|---|---|
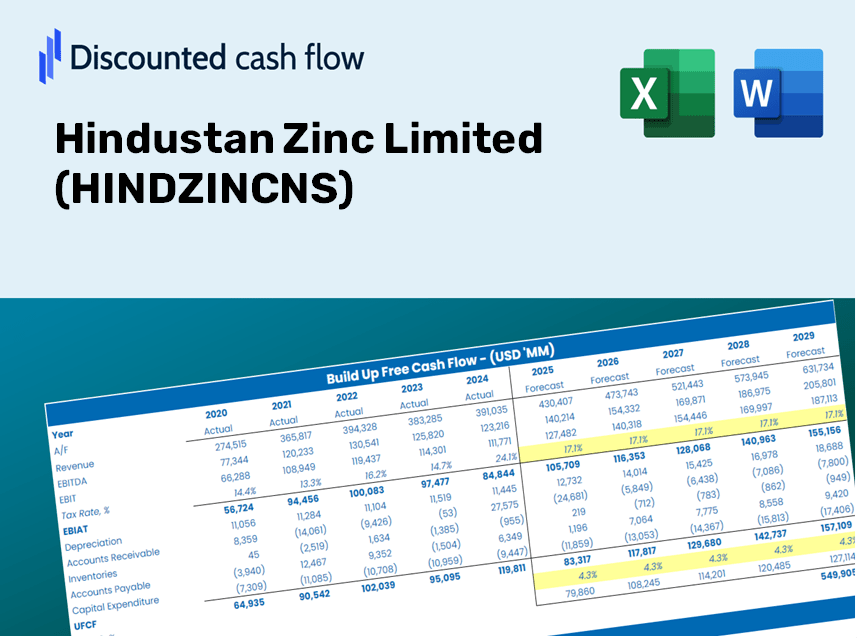
| Revenue | 220,710.0 | 282,330.0 | 328,830.0 | 301,430.0 | 330,410.0 | 339,016.3 | 347,846.7 | 356,907.2 | 366,203.6 | 375,742.2 |
| Revenue Growth, % | 0 | 27.92 | 16.47 | -8.33 | 9.61 | 2.6 | 2.6 | 2.6 | 2.6 | 2.6 |
| EBITDA | 134,790.0 | 172,850.0 | 188,780.0 | 147,300.0 | 182,880.0 | 192,506.9 | 197,521.2 | 202,666.1 | 207,945.0 | 213,361.4 |
| EBITDA, % | 61.07 | 61.22 | 57.41 | 48.87 | 55.35 | 56.78 | 56.78 | 56.78 | 56.78 | 56.78 |
| Depreciation | 25,310.0 | 29,170.0 | 32,640.0 | 34,680.0 | 36,400.0 | 36,781.4 | 37,739.5 | 38,722.5 | 39,731.1 | 40,766.0 |
| Depreciation, % | 11.47 | 10.33 | 9.93 | 11.51 | 11.02 | 10.85 | 10.85 | 10.85 | 10.85 | 10.85 |
| EBIT | 109,480.0 | 143,680.0 | 156,140.0 | 112,620.0 | 146,480.0 | 155,725.5 | 159,781.7 | 163,943.6 | 168,213.8 | 172,595.4 |
| EBIT, % | 49.6 | 50.89 | 47.48 | 37.36 | 44.33 | 45.93 | 45.93 | 45.93 | 45.93 | 45.93 |
| Total Cash | 179,580.0 | 207,890.0 | 99,090.0 | 100,200.0 | 93,000.0 | 167,149.2 | 171,503.0 | 175,970.1 | 180,553.7 | 185,256.6 |
| Total Cash, percent | .0 | .0 | .0 | .0 | .0 | .0 | .0 | .0 | .0 | .0 |
| Account Receivables | 5,020.0 | 8,280.0 | 3,800.0 | 2,040.0 | 1,180.0 | 5,015.2 | 5,145.9 | 5,279.9 | 5,417.4 | 5,558.5 |
| Account Receivables, % | 2.27 | 2.93 | 1.16 | 0.67677 | 0.35713 | 1.48 | 1.48 | 1.48 | 1.48 | 1.48 |
| Inventories | 14,250.0 | 20,590.0 | 18,620.0 | 20,180.0 | 18,890.0 | 21,577.5 | 22,139.5 | 22,716.2 | 23,307.9 | 23,915.0 |
| Inventories, % | 6.46 | 7.29 | 5.66 | 6.69 | 5.72 | 6.36 | 6.36 | 6.36 | 6.36 | 6.36 |
| Accounts Payable | 15,450.0 | 20,380.0 | 20,880.0 | 21,060.0 | 22,040.0 | 23,206.1 | 23,810.5 | 24,430.7 | 25,067.1 | 25,720.0 |
| Accounts Payable, % | 7 | 7.22 | 6.35 | 6.99 | 6.67 | 6.85 | 6.85 | 6.85 | 6.85 | 6.85 |
| Capital Expenditure | -24,810.0 | -29,980.0 | -35,610.0 | -38,660.0 | -40,060.0 | -39,081.1 | -40,099.0 | -41,143.5 | -42,215.2 | -43,314.8 |
| Capital Expenditure, % | -11.24 | -10.62 | -10.83 | -12.83 | -12.12 | -11.53 | -11.53 | -11.53 | -11.53 | -11.53 |
| Tax Rate, % | 23.61 | 23.61 | 23.61 | 23.61 | 23.61 | 23.61 | 23.61 | 23.61 | 23.61 | 23.61 |
| EBITAT | 82,622.5 | 98,120.2 | 107,351.4 | 84,779.1 | 111,894.6 | 113,424.2 | 116,378.6 | 119,410.0 | 122,520.3 | 125,711.6 |
| Depreciation | ||||||||||
| Changes in Account Receivables | ||||||||||
| Changes in Inventories | ||||||||||
| Changes in Accounts Payable | ||||||||||
| Capital Expenditure | ||||||||||
| UFCF | 79,302.5 | 92,640.2 | 111,331.4 | 81,179.1 | 111,364.6 | 105,767.9 | 113,930.9 | 116,898.5 | 119,943.3 | 123,067.5 |
| WACC, % | 6.34 | 6.3 | 6.31 | 6.34 | 6.34 | 6.33 | 6.33 | 6.33 | 6.33 | 6.33 |
| PV UFCF | ||||||||||
| SUM PV UFCF | 481,903.0 | |||||||||
| Long Term Growth Rate, % | 4.00 | |||||||||
| Free cash flow (T + 1) | 127,990 | |||||||||
| Terminal Value | 5,501,164 | |||||||||
| Present Terminal Value | 4,048,041 | |||||||||
| Enterprise Value | 4,529,944 | |||||||||
| Net Debt | 114,400 | |||||||||
| Equity Value | 4,415,544 | |||||||||
| Diluted Shares Outstanding, MM | 4,230 | |||||||||
| Equity Value Per Share | 1,043.86 |
What You Will Receive
- Authentic Hindustan Zinc Data: Preloaded financial metrics – covering everything from revenue to EBIT – derived from actual and projected figures.
- Complete Customization: Modify all essential parameters (yellow cells) including WACC, growth %, and tax rates.
- Instant Valuation Adjustments: Automatic recalculations to assess the effect of changes on Hindustan Zinc’s fair value.
- Flexible Excel Template: Designed for quick modifications, scenario analysis, and comprehensive forecasts.
- Efficient and Precise: Avoid the hassle of building models from scratch while ensuring accuracy and adaptability.
Key Features
- Customizable Forecast Inputs: Adjust vital parameters such as revenue growth, EBITDA percentage, and capital expenditures.
- Instant DCF Valuation: Quickly computes intrinsic value, net present value (NPV), and other essential metrics.
- High-Precision Accuracy: Utilizes Hindustan Zinc Limited's real financial data for authentic valuation results.
- Simplified Scenario Evaluation: Effortlessly test various assumptions and assess different outcomes.
- Efficiency Boost: Streamline the valuation process without the hassle of creating complicated models from the ground up.
How It Works
- Step 1: Download the prebuilt Excel template featuring data for Hindustan Zinc Limited (HINDZINCNS).
- Step 2: Navigate through the pre-filled sheets to familiarize yourself with the essential metrics.
- Step 3: Modify forecasts and assumptions in the editable yellow cells (WACC, growth, margins).
- Step 4: Instantly view recalculated results, including the intrinsic value of Hindustan Zinc Limited (HINDZINCNS).
- Step 5: Make well-informed investment decisions or create reports based on the outputs.
Why Choose This Calculator for Hindustan Zinc Limited (HINDZINCNS)?
- Accurate Data: Utilize genuine financials from Hindustan Zinc for dependable valuation outcomes.
- Customizable: Tailor essential parameters such as growth rates, WACC, and tax rates to align with your forecasts.
- Time-Saving: Pre-configured calculations save you the hassle of starting from the ground up.
- Professional-Grade Tool: Crafted for investors, analysts, and industry consultants.
- User-Friendly: With a straightforward design and guided instructions, it's accessible for users of all levels.
Who Can Benefit from Hindustan Zinc Limited (HINDZINCNS)?
- Investors: Make informed investment choices with our industry-leading valuation tools.
- Financial Analysts: Enhance efficiency with our ready-to-customize DCF model.
- Consultants: Effortlessly modify the template for impactful client presentations and reports.
- Finance Enthusiasts: Expand your knowledge of valuation methods through our real-life case studies.
- Educators and Students: Utilize this resource as a hands-on learning aid in finance courses.
What the Template Includes
- Operating and Balance Sheet Data: Pre-filled historical data and forecasts for Hindustan Zinc Limited (HINDZINCNS), covering revenue, EBITDA, EBIT, and capital expenditures.
- WACC Calculation: A dedicated sheet for computing the Weighted Average Cost of Capital (WACC), featuring key parameters such as Beta, risk-free rate, and share price.
- DCF Valuation (Unlevered and Levered): Editable Discounted Cash Flow models that present intrinsic value along with comprehensive calculations.
- Financial Statements: Pre-loaded financial statements (annual and quarterly) to facilitate thorough analysis.
- Key Ratios: Includes profitability, leverage, and efficiency ratios specific to Hindustan Zinc Limited (HINDZINCNS).
- Dashboard and Charts: A visual summary of valuation outputs and assumptions for easy analysis of results.
Disclaimer
All information, articles, and product details provided on this website are for general informational and educational purposes only. We do not claim any ownership over, nor do we intend to infringe upon, any trademarks, copyrights, logos, brand names, or other intellectual property mentioned or depicted on this site. Such intellectual property remains the property of its respective owners, and any references here are made solely for identification or informational purposes, without implying any affiliation, endorsement, or partnership.
We make no representations or warranties, express or implied, regarding the accuracy, completeness, or suitability of any content or products presented. Nothing on this website should be construed as legal, tax, investment, financial, medical, or other professional advice. In addition, no part of this site—including articles or product references—constitutes a solicitation, recommendation, endorsement, advertisement, or offer to buy or sell any securities, franchises, or other financial instruments, particularly in jurisdictions where such activity would be unlawful.
All content is of a general nature and may not address the specific circumstances of any individual or entity. It is not a substitute for professional advice or services. Any actions you take based on the information provided here are strictly at your own risk. You accept full responsibility for any decisions or outcomes arising from your use of this website and agree to release us from any liability in connection with your use of, or reliance upon, the content or products found herein.