
|
Heliogen, Inc. (HLGN): 5 FORCES Analysis [Nov-2025 Updated] |
Fully Editable: Tailor To Your Needs In Excel Or Sheets
Professional Design: Trusted, Industry-Standard Templates
Investor-Approved Valuation Models
MAC/PC Compatible, Fully Unlocked
No Expertise Is Needed; Easy To Follow
Heliogen, Inc. (HLGN) Bundle
You're trying to get a clear read on Heliogen, Inc. as it heads into the expected Q3 2025 closing of the Zeo Energy Corp. acquisition, and frankly, the competitive landscape before the deal was shaky; remember, they posted only $23.2 million in revenue for 2024 against a $(52.0) million Adjusted EBITDA loss. That financial reality clashes directly with their high-tech moat-that proprietary AI for heliostat alignment-which keeps new entrants out. Still, the threat from cheaper, mature substitutes like standard PV solar is defintely real, meaning the power balance across suppliers, customers, and rivals is about to shift dramatically. Let's cut through the noise and map out exactly where the leverage sits now.
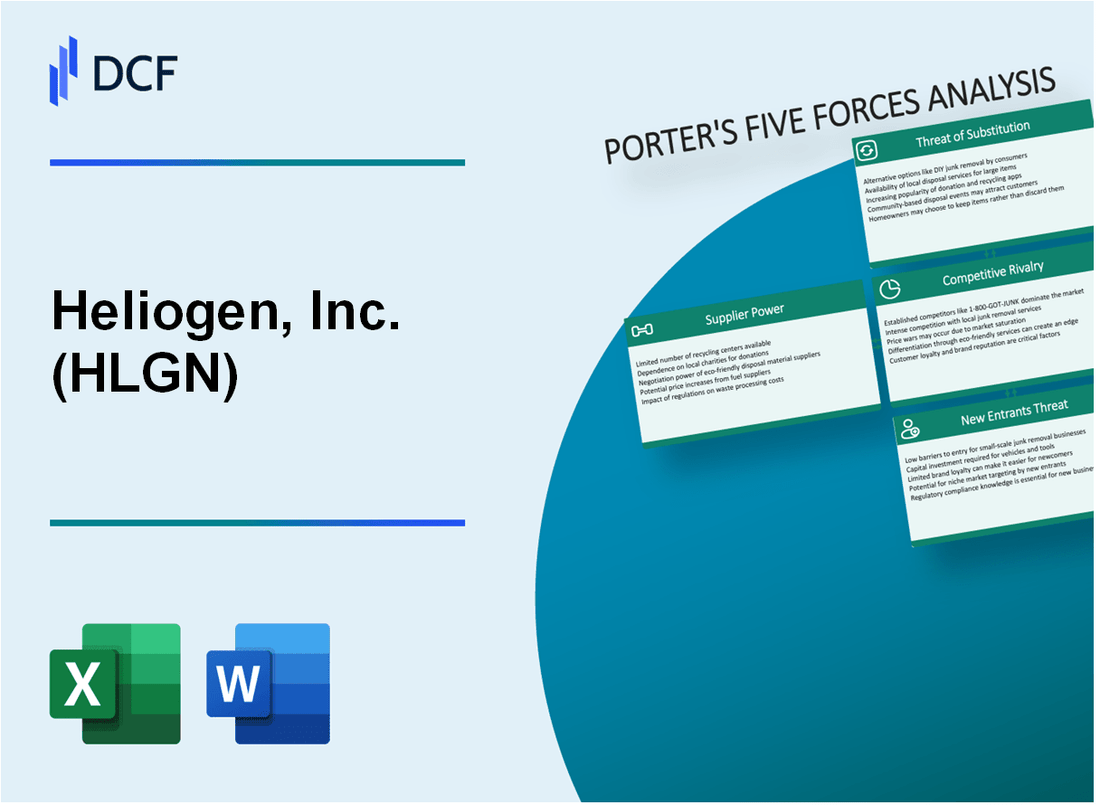
Heliogen, Inc. (HLGN) - Porter's Five Forces: Bargaining power of suppliers
You're looking at the supplier landscape for Heliogen, Inc. as of late 2025, right after the acquisition by Zeo Energy Corp. on August 8, 2025. That deal, valued at $10 million, fundamentally changes the capital structure, but the underlying supply chain dynamics for their core technology remain a critical factor for profitability.
The power held by Heliogen's suppliers isn't uniform; it splits sharply depending on what they are providing. For basic, high-volume inputs, suppliers have very little leverage over Heliogen, Inc. Remember, the company listed steel, glass (float glass), copper, aluminum, and commodity electrical/electronics components as key raw materials in earlier filings. These are generally available from numerous domestic and international sources.
Here's a quick look at how that power breaks down across the component spectrum:
| Component Category | Examples | Supplier Bargaining Power (Context: Late 2025) |
|---|---|---|
| Commodity Components | Steel, Float Glass, Aluminum | Low |
| Specialized/Proprietary Technology | Solar Receiver, Heat Engines, $\text{CO}_2$ Turbine Technology | High |
On the other side of the ledger, suppliers of specialized, proprietary components wield significant power. Think about the core of the concentrated solar power (CSP) system. Heliogen, Inc. has historically relied on specific industry leaders for critical, non-standard parts. For instance, they collaborated with Hanwha Power Systems on supercritical $\text{CO}_2$ turbine technology, and they developed a novel particle heat exchanger (PHX) design. When a supplier holds the key intellectual property or has successfully qualified their component for a unique system like Heliogen's AI-driven heliostat field, their leverage shoots up. If you only have one or two qualified sources for a solar receiver, you pay their price.
The strategic shift toward a technology-centric, capital-light model further complicates this. Back in May 2024, Heliogen, Inc. took steps to reduce fixed costs, including closing the Long Beach manufacturing facility and cutting third-party costs. This move, which was part of a targeted plan, signals an increased reliance on third-party component manufacturers and specialized engineering partners to build out the hardware, rather than keeping that capacity in-house. Honestly, moving to a capital-light structure often means trading fixed costs for variable costs, which can mean surrendering some control to external partners.
This dynamic is amplified by the company's production scale. For a technology company, leverage with suppliers is often tied to order volume. Consider the financial reality: Heliogen, Inc. reported total revenue of only $23.2 million for the full year 2024. That is a relatively low volume in the capital-intensive energy sector. Low production volume means Heliogen, Inc. has limited leverage to demand lower prices or better terms from suppliers, especially those providing unique, high-value parts. If onboarding takes 14+ days, churn risk rises, and that risk is higher when you can't place massive, guaranteed orders.
The supplier power assessment boils down to this:
- Commodity component suppliers face low power due to readily available inputs.
- Proprietary technology suppliers have high power due to unique IP.
- The capital-light pivot increases dependence on external manufacturing partners.
- Low 2024 revenue of $23.2 million restricts negotiation muscle.
Finance: draft a supplier risk matrix for the top 5 specialized component contracts by next Tuesday.
Heliogen, Inc. (HLGN) - Porter's Five Forces: Bargaining power of customers
You're analyzing Heliogen, Inc. (HLGN) now, and the customer side of the equation is definitely a mixed bag. When you look at who buys this kind of high-temperature, dispatchable clean energy, you're dealing with industrial giants. This means their bargaining power is inherently high because of the sheer scale of their energy needs.
For instance, hyperscale data centers-a key target market-can have electricity as an operating expense (OpEx) that accounts for over 60 percent of their total operating costs. The power needed for just one of these facilities can equal that of 80,000 households. When the energy spend is that significant, customers hold the cards when negotiating terms for a multi-decade power solution.
Here's a quick look at how concentrated that customer base is, based on recent pipeline data. The fact that Heliogen, Inc. needed only a handful of early-stage prospects to build a significant portion of its pipeline shows customer leverage. As of the second quarter of 2024, outstanding proposals with just 4 customers represented 0.9 gigawatts of potential early design work. If you were looking to meet a 1.0 GW target, landing just four major industrial clients gives them significant negotiating weight, so you have to manage those relationships carefully.
The leverage these large customers have is somewhat offset, though, by the nature of the technology itself. Heliogen, Inc.'s proprietary system offers capabilities that few others can match, which acts as a powerful counter-negotiation tool. You can't easily walk across the street to get the same thing.
The mitigation factor comes down to two core technological advantages:
- High-Temperature Capability: Heliogen, Inc.'s Concentrated Solar Power (CSP) systems are engineered to achieve temperatures exceeding 1,000°C. This temperature level is critical for decarbonizing hard-to-abate sectors like cement and steel production.
- AI Precision: Third-party validation at Sandia National Laboratories confirmed that Heliogen's proprietary closed-loop AI/computer vision system can calibrate and correct heliostat positioning with 3x more accuracy. This precision directly translates to better performance and reliability for the customer.
Now, let's talk about locking them in. Once a customer commits to a custom CSP system, the switching costs become substantial. While the modular design helps reduce operational downtime risk, the capital investment in a bespoke, integrated solar thermal plant creates a high barrier to exit. If a customer decides to switch providers or technology mid-stream, they face massive sunk costs in site-specific infrastructure and integration.
To put the customer leverage and mitigation into perspective, consider this snapshot of Heliogen, Inc.'s financial position as of late 2024/early 2025. While the company was acquired by Zeo Energy Corp. in May 2025, the preceding financial health shows the context in which these customer negotiations occurred:
| Metric | Value/Context | Relevance to Customer Power |
|---|---|---|
| Liquidity (as of Dec 31, 2024) | $36.9 million | Lower liquidity might make Heliogen, Inc. more eager to close deals, potentially conceding on terms. |
| Key Customer Industries | Data Centers, Mining, Chemicals, Oil & Gas, Cement | These are large, energy-intensive users, inherently increasing their bargaining power. |
| Data Center OpEx Share | Electricity is over 60 percent of OpEx. | High cost exposure means customers aggressively seek favorable, stable pricing. |
| AI Accuracy Improvement | 3x more accuracy vs. baseline. | Proprietary tech advantage mitigates power by offering superior, hard-to-replicate performance. |
| Net Assets (as of March 2025) | $23.02 Million USD | Reflects the capital base backing the long-term commitments made to customers. |
The power of the customer is directly proportional to the size of the project and the criticality of the energy supply. Still, Heliogen, Inc.'s ability to deliver over 1,000°C heat with AI-driven precision means they are selling a unique capability, not just a commodity kilowatt-hour. Finance: draft 13-week cash view by Friday.
Heliogen, Inc. (HLGN) - Porter's Five Forces: Competitive rivalry
You're analyzing the competitive landscape for Heliogen, Inc. (HLGN) right before its integration into Zeo Energy Corp., and the rivalry is defined by the massive scale and cost structure of incumbent technologies. Honestly, the numbers from 2024 paint a clear picture of a company fighting for footing before the merger closed.
Heliogen, Inc.'s financial performance prior to the August 8, 2025, acquisition by Zeo Energy Corp. showed significant operational strain. The full year 2024 Adjusted EBITDA loss stood at a substantial $(52.0) million. This loss, coupled with a liquidity position of only $36.9 million as of December 31, 2024, placed Heliogen, Inc. in a financially weak position relative to established, well-capitalized utility-scale energy providers.
The competitive rivalry is high due to the sheer dominance of established utility-scale energy providers and Engineering, Procurement, and Construction (EPC) firms. While direct competition from other Concentrated Solar Power (CSP) companies was historically low, the overall renewable energy field is intensely competitive, primarily driven by the cost-effectiveness of Photovoltaic (PV) solar. Utility-scale solar PV LCOE (Levelized Cost of Electricity) in the US ranged from $0.038 per kWh to $0.078 per kWh unsubsidized in mid-2025. Globally, utility-scale solar PV with single-axis tracking offered some of the lowest LCOE figures, with China reaching as low as US$27/MWh (or $0.027/kWh) in 2025.
This cost disparity heightens the rivalry because Heliogen, Inc.'s technology, while offering on-demand, high-capacity factor thermal energy, must compete against PV, which commands 42% of the global renewable market, valued between $420-500 billion in 2025.
The acquisition by Zeo Energy Corp. in Q3 2025, which officially closed on August 8, 2025, fundamentally alters this competitive structure for the combined entity. The transaction was an all-stock deal, and Zeo Energy received approximately $13.6 million in net cash from Heliogen, Inc. upon closing. Heliogen, Inc.'s common stock, trading as HLGN, ceased trading on the OTCQX on that date. The strategic intent was to leverage Heliogen's technology within Zeo Energy's broader platform, moving the competitive focus from a standalone, cash-burning technology developer to a division within a larger, residential-to-utility-scale clean energy platform.
Here's a snapshot of the pre-acquisition financial context that informed the need for a strategic shift:
| Metric | Value (Full Year 2024) | Source Context |
| Adjusted EBITDA Loss | $(52.0) million | Indicates significant pre-revenue/pre-scale operating burn. |
| Liquidity (Dec 31, 2024) | $36.9 million | Limited runway without external capital or strategic change. |
| Q1 2025 Net Loss | USD 6.36 million | Continuation of cash burn into the acquisition quarter. |
| Acquisition Cash Received | $13.6 million | Net cash infusion upon closing of the Zeo Energy merger. |
The competitive environment facing Heliogen, Inc. before the merger was characterized by:
- Intense cost pressure from utility-scale PV solar.
- Dominance of established EPC firms in large-scale deployment.
- Need for dispatchable power to compete with intermittent sources.
- Heliogen's pipeline included proposals totaling over 2 gigawatts.
The rivalry structure is now that of a subsidiary within Zeo Energy Corp., aiming to serve commercial and industrial-scale facilities, particularly AI and cloud computing data centers, which require the on-demand capability that PV/storage combinations might not yet offer as cost-effectively for high-capacity factor needs.
Heliogen, Inc. (HLGN) - Porter's Five Forces: Threat of substitutes
You're assessing the competitive landscape for Heliogen, Inc. (HLGN) as it seeks to commercialize its concentrated solar power (CSP) technology for industrial heat. The threat of substitutes is significant because the industrial sector has relied on established, often cheaper, energy sources for decades. To be fair, the threat level varies dramatically depending on the specific application-whether it's general electricity generation or niche, ultra-high-temperature process heat.
High threat from cheaper, mature substitutes like standard PV solar coupled with battery storage
For applications where Heliogen, Inc. (HLGN) competes on electricity generation (HelioPower) or lower-temperature heat that can be electrified, standard photovoltaic (PV) solar coupled with battery storage presents a mature, cost-competitive alternative. Lazard's 2025 Levelized Cost of Energy+ report provides a useful, though not direct, comparison for electricity generation. Unsubsidized utility-scale solar LCOE ranges from $0.038/kWh to $0.078/kWh. When you add co-located energy storage for two hours, the LCOE range for solar-plus-storage is estimated between $0.05/kWh and $0.131/kWh. This directly pressures Heliogen, Inc. (HLGN)'s power offerings, especially since the company's own contracted revenue backlog of $76.2 million (as of Q1 2024) included hybrid PV solutions.
Here's a quick look at how these electricity substitutes stack up:
| Technology | Unsubsidized LCOE Range (2025 Estimate) | Key Characteristic |
|---|---|---|
| Utility-Scale Solar PV (Standalone) | $0.038/kWh to $0.212/kWh | Intermittent, very low marginal cost |
| Solar PV + 2-Hour Battery Storage | $0.05/kWh to $0.131/kWh | Adds firming capability |
| Combined Cycle Natural Gas (New Build) | $0.048/kWh to $0.107/kWh | Dispatchable, but fuel-dependent |
What this estimate hides is the Levelized Cost of Heat (LCOH) for industrial processes, which is Heliogen, Inc. (HLGN)'s primary target. Still, the maturity and falling costs of PV and storage mean that any application below Heliogen, Inc. (HLGN)'s target temperature threshold faces intense price competition.
Extremely high threat from traditional fossil fuels for industrial heat, which are often cheaper upfront
The threat from traditional fossil fuels, primarily natural gas and coal, remains extremely high for industrial heat, which accounts for 20% of global energy demand. Historically, fossil fuels were the only financially and technologically viable option for the high temperatures required. The upfront cost advantage of existing fossil fuel infrastructure is a major hurdle. To be clear, the market is still heavily influenced by historical investment and subsidies; about $7 trillion was spent on fossil fuels in 2022, including subsidies and unpriced damages. Furthermore, federal tax expenditures for natural gas and petroleum subsidies alone totaled $2.1 billion in fiscal year 2022.
Even though Heliogen, Inc. (HLGN) aims to deliver carbon-free heat at a cost lower than fossil fuels, the incumbent systems benefit from established supply chains and lower initial capital expenditure (CapEx) relative to deploying a new CSP system. For lower-temperature heat, even electric substitutes like heat pumps show that gas boilers can have a lifetime cost 14% higher than heat pumps under current policies, but the initial CapEx for the heat pump is the barrier.
Threat is low in the niche market for continuous, 24/7 high-temperature process heat and green hydrogen
The threat of substitution drops considerably when considering Heliogen, Inc. (HLGN)'s core value proposition: providing continuous, 24/7 carbon-free thermal energy and steam, often exceeding 1,000°C. This capability, enabled by pairing concentrated sunlight with thermal energy storage, targets sectors like cement, steel, and petrochemicals that require high-density, on-demand heat. For green hydrogen production (HelioFuel), Heliogen, Inc. (HLGN) has shown its system can use 45 percent less electricity than low-temperature PEM and alkaline electrolyzers when coupled with a Bloom electrolyzer.
The substitutes struggle here:
- Standard PV solar is intermittent and requires massive, expensive storage to match 24/7 industrial demand.
- Fossil fuels cannot meet the deep decarbonization mandate without carbon capture, which adds significant cost and complexity.
- Geothermal and nuclear, while offering firm power, require massive, long-lead-time infrastructure buildouts, unlike Heliogen, Inc. (HLGN)'s modular approach.
Other clean energy substitutes include geothermal and small modular nuclear reactors
Geothermal energy and Small Modular Reactors (SMRs) represent other clean, firm energy substitutes, though they face their own economic and deployment challenges as of late 2025. Using Lazard's 2025 LCOE estimates for electricity generation as a proxy for the cost floor of these technologies, both are generally more expensive than unsubsidized solar PV.
The comparative LCOE ranges for these firm, non-fossil alternatives are:
- Geothermal LCOE: $0.141/kWh to $0.220/kWh.
- Nuclear LCOE: $0.141/kWh to $0.220/kWh.
Geothermal projects, for instance, benefit from a 30% Investment Tax Credit (ITC) with prevailing wage and apprenticeship requirements. Still, the high capital intensity and geological constraints limit their immediate substitutability for Heliogen, Inc. (HLGN)'s distributed industrial heat solution. Finance: draft 13-week cash view by Friday.
Heliogen, Inc. (HLGN) - Porter's Five Forces: Threat of new entrants
The threat of new entrants into the specialized, high-temperature Concentrated Solar Power (CSP) segment that Heliogen, Inc. focused on is generally low. This is due to substantial financial, technological, and regulatory barriers that new competitors must overcome to achieve commercial scale.
Low threat due to extremely high capital requirements for initial CSP project deployment.
Building utility-scale CSP facilities requires massive upfront capital expenditure (CapEx), which acts as a significant deterrent. New entrants face the same high initial investment hurdle that Heliogen, Inc. navigated. For instance, established CSP technologies show installed costs that are inherently high, even before factoring in the novel Gen 3 technology Heliogen pursued.
Here's a look at the capital intensity for comparable, established CSP projects, which sets the baseline for any new entrant:
| CSP Technology Type | Storage Duration (Hours) | Estimated Capital Cost (USD/kW) |
|---|---|---|
| Parabolic Trough (No Storage) | N/A | As low as 4,600 |
| Parabolic Trough (With Storage) | 6 | 7,100 to 9,800 |
| Solar Tower (With Storage) | 6 to 15 | 6,300 to 10,500 |
The global weighted average total installed cost for CSP plants in 2022 was estimated to be on the order of USD 5,836/kW, illustrating the scale of investment needed even for existing designs. Heliogen's own Gen 3 demonstration project, Capella, targeting a 5-MWe plant, was halted after the front-end engineering and design phase due to cost escalation, underscoring the financial risk inherent in pioneering this specific technology.
High barrier from Heliogen's proprietary AI and computer vision software for heliostat alignment.
The precision required for Heliogen, Inc.'s technology to achieve ultra-high temperatures is maintained by proprietary software, creating an intellectual property and technical know-how barrier. This AI-enabled system moves beyond manual alignment, which is slow and less accurate.
The efficacy of this specialized software has been validated by third parties, demonstrating a superior performance metric:
- Tracking error reduced to 0.33 mrad.
- Surpassed the project target of less than 1.0 mrad.
- Reduced the need for human intervention in calibration.
A new entrant would need to develop comparable, validated, and patented control systems, or license the technology, which requires significant R&D investment and time to prove reliability outside of a lab setting.
Significant technological barriers exist for achieving and maintaining temperatures above 1,000°C.
The ability to consistently generate heat above 1,000°C is a key differentiator for Heliogen, Inc.'s technology, allowing it to target hard-to-abate industrial heat markets like cement and steel production. This temperature threshold is a significant technical hurdle that separates this niche from standard CSP or lower-temperature renewables.
Heliogen, Inc. publicly demonstrated the capability to exceed 1,000 degrees Celsius back in November 2019. For a new competitor, replicating this specific thermal performance requires mastering advanced receiver design and heat transfer materials, which is not a simple scale-up of existing commercial solar tower technology. The technology must also integrate thermal energy storage to provide dispatchable power, adding another layer of complexity.
Regulatory hurdles and long lead times for large-scale energy projects deter quick entry.
Large-scale energy infrastructure projects, like CSP plants, are subject to extensive regulatory review, which naturally slows down any potential competitor's entry timeline. Even with recent federal permitting reforms in 2025, which aim to cut review times by 6-12 months for some solar projects, the process remains lengthy.
For projects requiring the most rigorous review, such as those on federal lands needing a comprehensive Environmental Impact Statement under NEPA, delays can still stretch project timelines by 12-24 months. This extended lead time, combined with the capital intensity, means a new entrant's path to revenue generation is measured in years, not quarters. The fact that Heliogen's 5-MWe Capella project did not move past the design phase into construction also highlights the real-world friction in project execution.
Disclaimer
All information, articles, and product details provided on this website are for general informational and educational purposes only. We do not claim any ownership over, nor do we intend to infringe upon, any trademarks, copyrights, logos, brand names, or other intellectual property mentioned or depicted on this site. Such intellectual property remains the property of its respective owners, and any references here are made solely for identification or informational purposes, without implying any affiliation, endorsement, or partnership.
We make no representations or warranties, express or implied, regarding the accuracy, completeness, or suitability of any content or products presented. Nothing on this website should be construed as legal, tax, investment, financial, medical, or other professional advice. In addition, no part of this site—including articles or product references—constitutes a solicitation, recommendation, endorsement, advertisement, or offer to buy or sell any securities, franchises, or other financial instruments, particularly in jurisdictions where such activity would be unlawful.
All content is of a general nature and may not address the specific circumstances of any individual or entity. It is not a substitute for professional advice or services. Any actions you take based on the information provided here are strictly at your own risk. You accept full responsibility for any decisions or outcomes arising from your use of this website and agree to release us from any liability in connection with your use of, or reliance upon, the content or products found herein.