
|
Houlihan Lokey, Inc. (HLI) DCF Valuation |
Fully Editable: Tailor To Your Needs In Excel Or Sheets
Professional Design: Trusted, Industry-Standard Templates
Investor-Approved Valuation Models
MAC/PC Compatible, Fully Unlocked
No Expertise Is Needed; Easy To Follow
Houlihan Lokey, Inc. (HLI) Bundle
Discover the true value of Houlihan Lokey, Inc. (HLI) with our advanced DCF Calculator! Adjust key assumptions, explore various scenarios, and assess how changes affect the valuation of Houlihan Lokey, Inc. (HLI) – all within a user-friendly Excel template.
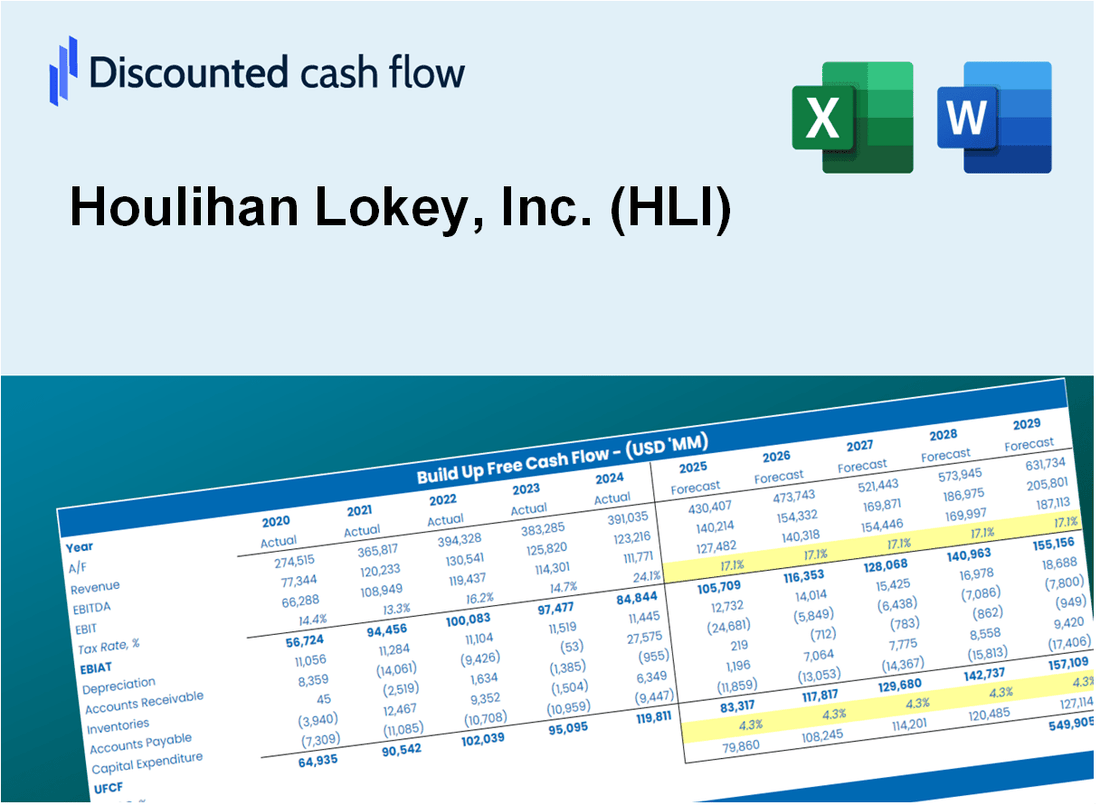
Discounted Cash Flow (DCF) - (USD MM)
| Year | AY1 2021 |
AY2 2022 |
AY3 2023 |
AY4 2024 |
AY5 2025 |
FY1 2026 |
FY2 2027 |
FY3 2028 |
FY4 2029 |
FY5 2030 |
|---|---|---|---|---|---|---|---|---|---|---|
| Revenue | 1,525.5 | 2,270.0 | 1,809.4 | 1,914.4 | 2,389.4 | 2,742.6 | 3,148.1 | 3,613.5 | 4,147.6 | 4,760.8 |
| Revenue Growth, % | 0 | 48.81 | -20.29 | 5.8 | 24.81 | 14.78 | 14.78 | 14.78 | 14.78 | 14.78 |
| EBITDA | 423.4 | 661.4 | 435.0 | 427.6 | 597.6 | 703.7 | 807.7 | 927.1 | 1,064.1 | 1,221.4 |
| EBITDA, % | 27.75 | 29.14 | 24.04 | 22.34 | 25.01 | 25.66 | 25.66 | 25.66 | 25.66 | 25.66 |
| Depreciation | 15.2 | 48.5 | 58.2 | 28.5 | 41.3 | 52.5 | 60.3 | 69.2 | 79.4 | 91.1 |
| Depreciation, % | 0.99826 | 2.14 | 3.22 | 1.49 | 1.73 | 1.91 | 1.91 | 1.91 | 1.91 | 1.91 |
| EBIT | 408.2 | 612.9 | 376.8 | 399.1 | 556.3 | 651.2 | 747.4 | 857.9 | 984.7 | 1,130.3 |
| EBIT, % | 26.76 | 27 | 20.82 | 20.85 | 23.28 | 23.74 | 23.74 | 23.74 | 23.74 | 23.74 |
| Total Cash | 846.9 | 833.7 | 720.7 | 728.8 | 1,138.3 | 1,194.6 | 1,371.2 | 1,573.9 | 1,806.6 | 2,073.6 |
| Total Cash, percent | .0 | .0 | .0 | .0 | .0 | .0 | .0 | .0 | .0 | .0 |
| Account Receivables | 226.5 | 248.8 | 314.8 | 424.5 | 415.1 | 453.9 | 521.0 | 598.0 | 686.4 | 787.9 |
| Account Receivables, % | 14.85 | 10.96 | 17.4 | 22.17 | 17.37 | 16.55 | 16.55 | 16.55 | 16.55 | 16.55 |
| Inventories | .0 | .0 | .0 | .0 | .0 | .0 | .0 | .0 | .0 | .0 |
| Inventories, % | 0 | 0 | 0 | 0 | 0 | 0 | 0 | 0 | 0 | 0 |
| Accounts Payable | 67.5 | 126.2 | 113.4 | 114.2 | 137.2 | 153.4 | 176.0 | 202.0 | 231.9 | 266.2 |
| Accounts Payable, % | 4.42 | 5.56 | 6.27 | 5.96 | 5.74 | 5.59 | 5.59 | 5.59 | 5.59 | 5.59 |
| Capital Expenditure | -14.1 | -8.7 | -50.7 | -66.7 | -39.7 | -50.8 | -58.3 | -66.9 | -76.8 | -88.2 |
| Capital Expenditure, % | -0.92746 | -0.38239 | -2.8 | -3.49 | -1.66 | -1.85 | -1.85 | -1.85 | -1.85 | -1.85 |
| Tax Rate, % | 24.77 | 24.77 | 24.77 | 24.77 | 24.77 | 24.77 | 24.77 | 24.77 | 24.77 | 24.77 |
| EBITAT | 312.0 | 444.2 | 295.7 | 286.4 | 418.5 | 487.6 | 559.6 | 642.4 | 737.3 | 846.3 |
| Depreciation | ||||||||||
| Changes in Account Receivables | ||||||||||
| Changes in Inventories | ||||||||||
| Changes in Accounts Payable | ||||||||||
| Capital Expenditure | ||||||||||
| UFCF | 154.0 | 520.5 | 224.4 | 139.3 | 452.5 | 466.6 | 517.2 | 593.6 | 681.4 | 782.1 |
| WACC, % | 8.05 | 8.05 | 8.06 | 8.05 | 8.05 | 8.05 | 8.05 | 8.05 | 8.05 | 8.05 |
| PV UFCF | ||||||||||
| SUM PV UFCF | 2,376.1 | |||||||||
| Long Term Growth Rate, % | 2.00 | |||||||||
| Free cash flow (T + 1) | 798 | |||||||||
| Terminal Value | 13,181 | |||||||||
| Present Terminal Value | 8,949 | |||||||||
| Enterprise Value | 11,326 | |||||||||
| Net Debt | -533 | |||||||||
| Equity Value | 11,858 | |||||||||
| Diluted Shares Outstanding, MM | 69 | |||||||||
| Equity Value Per Share | 172.72 |
What You Will Get
- Real HLI Financials: Access to historical and projected data for precise valuation.
- Customizable Inputs: Adjust WACC, tax rates, revenue growth, and capital expenditures as needed.
- Dynamic Calculations: Intrinsic value and NPV are computed in real-time.
- Scenario Analysis: Evaluate various scenarios to assess Houlihan Lokey’s future performance.
- User-Friendly Design: Crafted for professionals while remaining approachable for newcomers.
Key Features
- Comprehensive HLI Data: Pre-loaded with Houlihan Lokey’s historical performance metrics and future projections.
- Customizable Assumptions: Modify revenue forecasts, operating margins, discount rates, tax implications, and investment expenditures.
- Adaptive Valuation Framework: Instant recalculations of Net Present Value (NPV) and intrinsic value based on user-defined parameters.
- What-If Analysis: Develop various forecasting scenarios to explore different valuation possibilities.
- Intuitive Interface: Clean, organized layout designed to accommodate both seasoned professionals and newcomers.
How It Works
- Step 1: Download the prebuilt Excel template with Houlihan Lokey’s (HLI) data included.
- Step 2: Explore the pre-filled sheets and familiarize yourself with the key metrics.
- Step 3: Update forecasts and assumptions in the editable yellow cells (WACC, growth, margins).
- Step 4: Instantly view recalculated results, including Houlihan Lokey’s (HLI) intrinsic value.
- Step 5: Make informed investment decisions or generate reports using the outputs.
Why Choose Houlihan Lokey, Inc. (HLI) Calculator?
- User-Friendly Interface: Perfect for both novices and seasoned professionals.
- Customizable Inputs: Adjust parameters easily to suit your financial models.
- Real-Time Insights: Watch immediate changes in Houlihan Lokey’s valuation as you tweak the inputs.
- Pre-Configured Data: Comes with Houlihan Lokey’s latest financial metrics for swift evaluations.
- Industry Trusted: Favored by financial experts and analysts for strategic decision-making.
Who Should Use This Product?
- Investment Professionals: Develop comprehensive financial analyses and models for informed decision-making.
- Corporate Strategy Teams: Evaluate financial scenarios to shape and refine business strategies.
- Financial Consultants: Deliver precise valuation assessments and insights for Houlihan Lokey, Inc. (HLI) clients.
- Academics and Students: Utilize real-time financial data for practice and instructional purposes in financial modeling.
- Market Analysts: Gain insights into the valuation processes of investment banking firms like Houlihan Lokey, Inc. (HLI).
What the Template Contains
- Pre-Filled Data: Includes Houlihan Lokey’s historical financials and forecasts.
- Discounted Cash Flow Model: Editable DCF valuation model with automatic calculations.
- Weighted Average Cost of Capital (WACC): A dedicated sheet for calculating WACC based on custom inputs.
- Key Financial Ratios: Analyze Houlihan Lokey’s profitability, efficiency, and leverage.
- Customizable Inputs: Edit revenue growth, margins, and tax rates with ease.
- Clear Dashboard: Charts and tables summarizing key valuation results.
Disclaimer
All information, articles, and product details provided on this website are for general informational and educational purposes only. We do not claim any ownership over, nor do we intend to infringe upon, any trademarks, copyrights, logos, brand names, or other intellectual property mentioned or depicted on this site. Such intellectual property remains the property of its respective owners, and any references here are made solely for identification or informational purposes, without implying any affiliation, endorsement, or partnership.
We make no representations or warranties, express or implied, regarding the accuracy, completeness, or suitability of any content or products presented. Nothing on this website should be construed as legal, tax, investment, financial, medical, or other professional advice. In addition, no part of this site—including articles or product references—constitutes a solicitation, recommendation, endorsement, advertisement, or offer to buy or sell any securities, franchises, or other financial instruments, particularly in jurisdictions where such activity would be unlawful.
All content is of a general nature and may not address the specific circumstances of any individual or entity. It is not a substitute for professional advice or services. Any actions you take based on the information provided here are strictly at your own risk. You accept full responsibility for any decisions or outcomes arising from your use of this website and agree to release us from any liability in connection with your use of, or reliance upon, the content or products found herein.