
|
Hudson Pacific Properties, Inc. (HPP): BCG Matrix [Apr-2026 Updated] |
Fully Editable: Tailor To Your Needs In Excel Or Sheets
Professional Design: Trusted, Industry-Standard Templates
Investor-Approved Valuation Models
MAC/PC Compatible, Fully Unlocked
No Expertise Is Needed; Easy To Follow
Hudson Pacific Properties, Inc. (HPP) Bundle
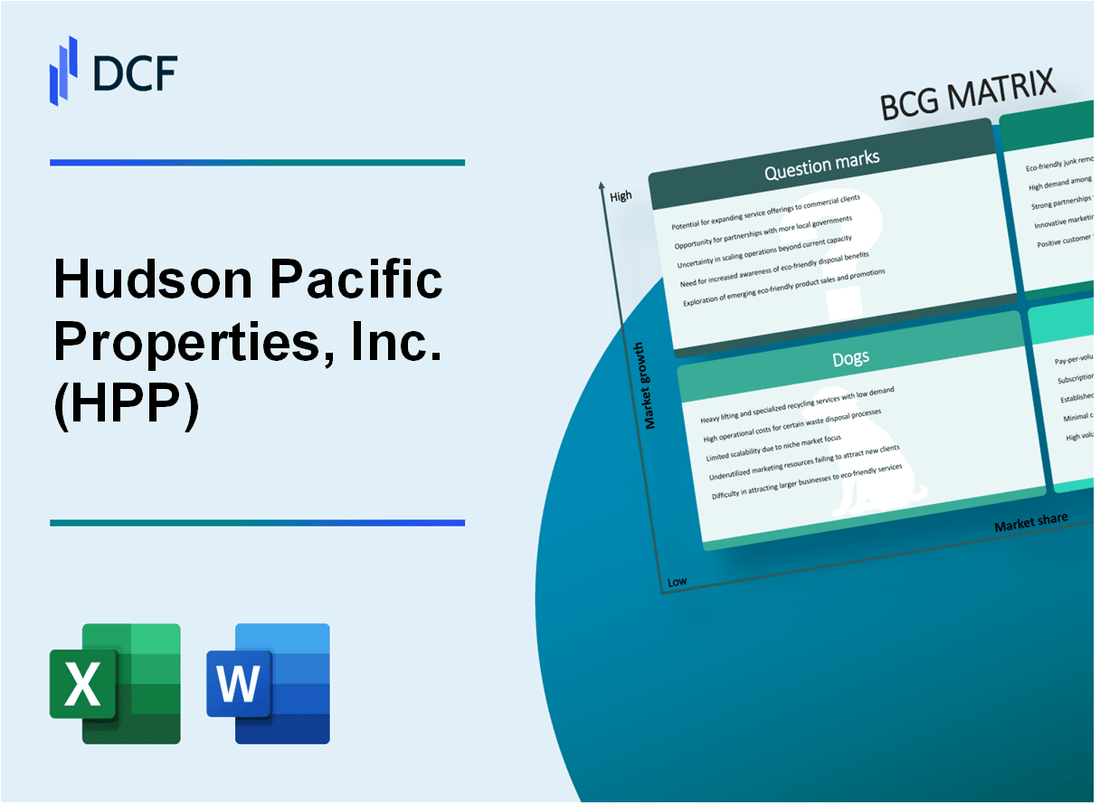
You're looking for a clear-eyed assessment of Hudson Pacific Properties, Inc.'s (HPP) core business lines, and the BCG Matrix is defintely the right tool to map their current strategic position. Right now, HPP's AI-driven Bay Area office assets are the clear Stars, capturing 80% of Q3 leasing, while the stabilized core portfolio acts as the Cash Cow, banking $186.6 million in Q3 revenue thanks to a strong balance sheet. Still, we see Dogs in office segments where cash rents are 10% lower, and the Studio business remains a Question Mark, needing to push its 65.8% stage leasing higher amid volatile production. Keep reading; this breakdown shows exactly where HPP needs to focus its capital and risk management efforts for the rest of 2025.
Background of Hudson Pacific Properties, Inc. (HPP)
You're looking to map out Hudson Pacific Properties, Inc. (HPP), a real estate investment trust (REIT) that focuses on providing end-to-end real estate solutions specifically for dynamic tech and media tenants. Honestly, their niche-being strategically positioned in global epicenters of innovation on the West Coast-is what sets them apart in this crowded sector. As of late 2025, HPP's portfolio centers on office and studio space, aiming to capture demand from high-growth industries like AI and technology.
Let's look at the numbers from their third quarter of 2025, which just wrapped up. Total revenue for the quarter landed at $186.6 million, a step down from the $200.4 million seen in the prior year, largely due to some asset sales and the ongoing process of leasing up their office space. You'll see that the reported net loss was significant, with an earnings per share (EPS) of -$0.30, missing the analyst forecast of -$0.185.
Still, the operational story shows some positive momentum you need to note. For instance, the company managed to cut its general and administrative (G&A) expenses by a solid 30%, bringing them down to $13.7 million. On the core business front, they executed 515,000 square feet of office leasing in the quarter, contributing to 1.7 million square feet signed year-to-date-their best leasing performance since 2019. This leasing push helped office portfolio occupancy tick up to 75.9%.
The studio side, which includes Quixote Studios, is also showing sequential improvement, though from a lower base. Studio stage leasing reached 65.8% leased on a trailing 12-month basis, an increase of 220 basis points from the prior quarter. The company's Funds From Operations (FFO), a key metric for REITs, was $16.7 million, or $0.04 per diluted share, in Q3 2025.
From a balance sheet perspective, Hudson Pacific Properties, Inc. has taken proactive steps to secure its footing. They report a strong liquidity position of $1 billion, which includes about $795.3 million in undrawn credit facility capacity. Critically, 100% of their debt is fixed or capped, and importantly, they have no debt maturities scheduled until the second half of 2026. This financial flexibility is a major point as they navigate the market, especially following the announcement of a reverse stock split slated for mid-November 2025.
Hudson Pacific Properties, Inc. (HPP) - BCG Matrix: Stars
You're looking at the segments of Hudson Pacific Properties, Inc. (HPP) that are currently driving market share in high-growth areas, which is the textbook definition of a Star in the Boston Consulting Group Matrix. For HPP, this is clearly centered on their premium office assets in the innovation hubs of the West Coast, particularly the San Francisco Bay Area, which is seeing a massive influx of capital and hiring from the Artificial Intelligence sector.
The operational data from the third quarter of 2025 clearly shows this concentration of success. We saw Hudson Pacific Properties, Inc. (HPP) capture a commanding share of the leasing activity in its most critical market. Specifically, over 80% of the third-quarter leasing activity occurred at their Bay Area assets. This isn't just general office demand; it's demand fueled by the high-growth AI expansion, validating the company's long-term thesis on asset location.
These Star assets are the leaders in the current leasing cycle, securing significant commitments from growth-oriented tenants. The quality of the space matters, as evidenced by the continued 'flight to quality' trend where tenants prioritize Class A properties with modern amenities. This is reflected in major deals, such as the lease signed with an AI company at Page Mill Center in Palo Alto, which was for 106,000 square feet or more. These are the deals that define market leadership right now.
Here's a quick look at the key Q3 2025 leasing metrics that position these assets as Stars:
| Metric | Value | Context |
| Q3 2025 Office Leases Executed | 515,000 square feet | Total office leasing volume for the quarter |
| Bay Area Leasing Concentration | 80% | Share of Q3 leasing activity concentrated in the Bay Area |
| Largest AI Lease (Page Mill Center) | 106,000+ square feet | Specific large new deal size with an AI tenant |
| Total Leasing Pipeline | 2,200,000 square feet | Forward-looking indicator of potential growth |
| Pipeline in Advanced Negotiation | Nearly 600,000 square feet | Near-term conversion potential within the pipeline |
| In-Service Office Occupancy | 75.9% | Portfolio health at quarter end |
The pipeline itself is a major indicator of future Star potential, as it represents the next wave of market share capture. Hudson Pacific Properties, Inc. (HPP) has a leasing pipeline standing at 2.2 million square feet. This substantial backlog, combined with the lowest lease expiration profile the company has had in four years, positions Hudson Pacific Properties, Inc. (HPP) to aggressively capitalize on the West Coast tech recovery.
These best-in-class office assets are located in core innovation hubs where, as the data suggests, demand from AI and tech tenants is clearly outstripping general market trends. The company is focused on maximizing the value of these high-quality spaces, which is why they are seeing success where others may not be. The operational execution is strong, evidenced by the 30% improvement in General and Administrative expenses year-over-year, which helps offset the cash burn associated with supporting these high-growth assets.
To keep these Stars shining, investment is key. You need to focus resources here to ensure these high-market-share positions are maintained until the market growth slows and they transition into Cash Cows. The current financial backing is in place to support this, with the company reporting $1 billion in total liquidity at the end of the third quarter.
The key operational takeaways for these Star assets are:
- Bay Area assets drove 80% of Q3 leasing volume.
- Secured a major AI deal exceeding 100,000 square feet.
- The total leasing pipeline is 2.2 million square feet.
- Office portfolio occupancy reached 75.9%.
- Q3 Revenue was $186.6 million.
If Hudson Pacific Properties, Inc. (HPP) sustains this leasing success as the high-growth phase for AI adoption matures, these assets will transition into the Cash Cow quadrant, providing stable, high-margin returns.
Hudson Pacific Properties, Inc. (HPP) - BCG Matrix: Cash Cows
You're looking at the units that keep the lights on, the ones that generate the necessary cash flow to fund the riskier bets in the portfolio. For Hudson Pacific Properties, Inc. (HPP), this is definitely the stabilized office segment.
The core, stabilized office portfolio is the engine here, responsible for the majority of the $186.6 million in total revenues reported for the third quarter of 2025. While total revenues saw a dip from the prior year, this segment represents the high market share in a mature, albeit recovering, market that defines a Cash Cow. You see the stability reflected in the leasing metrics, too; as of September 30, 2025, the office portfolio stood at 76.5% leased, and studio properties were 75.9% leased for the trailing twelve months. Still, the Same-Store Cash Net Operating Income (NOI) for Q3 2025 was $89.3 million, down from $100 million in the prior year, showing the pressure even market leaders feel.
This unit's strength is most evident in the balance sheet it supports. Hudson Pacific Properties, Inc. (HPP) ended the quarter with $1 billion of liquidity, which gives you real financial stability and flexibility. This liquidity consists of $190.4 million in unrestricted cash and $795.3 million of undrawn credit facility capacity. That's the cushion you want when managing a large real estate portfolio.
The debt structure is another key feature securing this cash flow. You'll be pleased to know that 100% of HPP's debt is fixed or capped. This minimizes interest rate risk, which is a huge plus, especially given that the company has no debt maturities until the second half of 2026. This structure helps ensure that the cash generated flows where it needs to go, rather than being eaten up by variable interest payments.
Management has also been laser-focused on strategic cost containment to maximize the cash yield from these assets. General and Administrative (G&A) expenses were reduced by 30% to $13.7 million in Q3 2025, a significant improvement from $19.5 million in the prior year. This efficiency directly boosts the bottom line, helping to offset operational headwinds. The Funds From Operations (FFO) excluding specified items reflects this discipline, coming in at $16.7 million, or $0.04 per diluted share, for the quarter.
Here are the key financial figures underpinning the Cash Cow status for Q3 2025:
| Metric | Value |
|---|---|
| Q3 2025 Total Revenue | $186.6 million |
| Q3 2025 G&A Expenses | $13.7 million |
| Q3 2025 Same-Store Cash NOI | $89.3 million |
| Total Liquidity | $1 billion |
| Debt Fixed or Capped Percentage | 100% |
| Office Portfolio Lease Rate (9/30/2025) | 76.5% |
These Cash Cows are the units you invest in to maintain productivity and generate the capital needed elsewhere. They are the bedrock.
- Invest to maintain current productivity levels.
- Milk gains passively for corporate funding.
- Support infrastructure to increase efficiency.
- Provide cash for Question Marks and R&D.
Finance: draft the full-year cash flow projection incorporating the Q3 G&A run-rate by next Tuesday.
Hudson Pacific Properties, Inc. (HPP) - BCG Matrix: Dogs
You're looking at the assets that are tying up capital without delivering the returns we need. These are the units where market share and growth are both lagging, making them prime candidates for divestiture or aggressive restructuring. Honestly, expensive turnarounds in this quadrant rarely pay off for Hudson Pacific Properties, Inc. (HPP).
The pressure on older, less competitive office space is clear in the leasing metrics. For instance, in the third quarter of 2025, cash rents on new and renewal office leases were 10% lower compared to prior lease levels. This drop is largely due to certain leases rolling off from peak pre-pandemic rates in areas like Palo Alto. This segment directly impacts the core profitability metric for stabilized properties.
Here's a quick look at the financial drag these underperforming assets represent:
| Metric | Q3 2025 Value | Prior Year Value | Change/Context |
|---|---|---|---|
| Same-Store Cash NOI | $89.3 million | $100 million | Decline primarily due to lower office occupancy. |
| Office Portfolio Occupancy | 75.9% | N/A | Sequential increase of 80 basis points, but still below target. |
| Office Leasing Volume (Q3 2025) | 515,000 sq ft | N/A | Represents execution, but the underlying assets are still challenged. |
| Weighted Average Diluted Shares | 457.1 million | 145.6 million (Prior Year) | Reflects share count increase following Q2 2025 offering. |
The strategy for these Dogs involves clear pruning. Hudson Pacific Properties, Inc. (HPP) is targeting non-core office assets for disposition, with an additional $125-$150 million in sales planned for 2025. [cite: outline] This signals a deliberate move to shed properties that don't fit the high-quality, tech/media-focused portfolio strategy, even if they are generating some cash.
We need to watch the lease expiration schedule closely, even though the overall portfolio profile is improving. The properties categorized here are those that have seen the sharpest declines, which often correlates with leases coming due soon. While management noted the overall portfolio has the lowest lease expiration profile in four years starting in the second half of 2025, the specific units falling into the Dog category are those where renewal is a significant risk due to their current underperformance.
The impact of these underperforming segments is visible when you look at the overall financial health metrics that management is working to offset:
- Office cash rents were 10% lower in Q3 2025 compared to prior lease levels.
- Same-Store Cash NOI declined to $89.3 million in Q3 2025 from $100 million year-over-year.
- Total revenue for Q3 2025 was $186.6 million, down from $200.4 million in the prior year, partly due to asset sales.
- The company reported an EPS loss of -$0.30 for the quarter.
Still, the company maintains $1 billion in liquidity. Finance: draft 13-week cash view by Friday to model the impact of the planned $125-$150 million in dispositions on the balance sheet.
Hudson Pacific Properties, Inc. (HPP) - BCG Matrix: Question Marks
You're looking at the studio segment of Hudson Pacific Properties, Inc. (HPP) as a classic Question Mark. These are areas with high potential growth-driven by market shifts-but currently hold a low market share, meaning they consume cash while waiting for that growth to materialize.
The studio segment itself shows signs of improvement but remains highly sensitive to production cycles. Trailing twelve-month leasing for in-service studio stages stood at 65.8% in the third quarter of 2025. That figure represented sequential improvement, up 220 basis points from the prior quarter, but it still reflects volatility in securing long-term occupancy. This unit needs heavy investment to quickly capture market share or it risks falling into the Dog quadrant.
Consider the specific development projects that fall into this category. New studio developments like Sunset Glenoaks, a project in the San Fernando Valley with an estimated 241K square feet and 7 stages completed around the second quarter of 2024, are prime examples. These assets require successful lease-up to generate the positive returns needed to justify the initial capital outlay. The volatility here is stark; the segment's exposure to fluctuating production activity is clear, with Los Angeles shoot days declining by 13% in the third quarter of 2025 compared to the prior year. Some reports put that decline even more precisely at 13.2% for Greater LA shoot days between July and September.
The financial strain is evident. The deconsolidation of the Sunset Glenoaks joint venture was cited as mostly attributable to the $136.5 million net loss HPP posted in the third quarter of 2025, a larger loss than the roughly $98 million incurred in the same period last year. Still, management has been aggressively managing costs; studio operations required significant cost-savings initiatives to finally approach breakeven Net Operating Income (NOI) in the third quarter of 2025. That's a critical step for a unit that has been a cash drain.
The future growth prospect, the reason this segment remains a Question Mark and not a Dog, lies in policy support. California's expanded and extended Film & Television Tax Credit Program is a major catalyst. Since July 2025, the program has allocated credits to 74 new productions, a massive jump from only 18 in the same period last year. This is the market growth you need to invest behind. The proposal to more than double the annual funds available in the program, from $350 million to $750 million annually, signals a high-growth market opportunity that Hudson Pacific Properties, Inc. (HPP) is poised to capture, provided the necessary investment is made to secure the resulting production slate.
Here is a quick look at the key studio metrics as of the third quarter of 2025:
| Metric | Value | Context/Period |
| In-Service Studio Stage Leasing (TTM) | 65.8% | Q3 2025 |
| Sunset Glenoaks Stage Leasing | 10.3% | Q3 2025 |
| In-Service Studio Stage Leasing (Excluding Sunset Glenoaks) | 82.3% | Q3 2025 |
| Greater LA Shoot Days Change | -13% to -13.2% | Q3 2025 vs. Prior Year |
| New Tax Credit Allocations Since July | 74 | Q3 2025 |
| Prior Year New Tax Credit Allocations Since July | 18 | Q3 2025 |
| Q3 2025 Studio Segment Loss (Attributable to SG) | $136.5 million | Q3 2025 |
The path forward for these Question Marks involves strategic choices based on this data. You need to decide where to place capital to quickly convert this potential into market share.
- Invest heavily to secure leases from the 74 new tax-credit-backed productions.
- Focus cost-savings initiatives to ensure NOI moves definitively past breakeven.
- Aggressively lease-up Sunset Glenoaks to improve the overall studio segment leasing from 65.8%.
- Monitor Los Angeles shoot days for a reversal from the 13% Q3 decline.
Disclaimer
All information, articles, and product details provided on this website are for general informational and educational purposes only. We do not claim any ownership over, nor do we intend to infringe upon, any trademarks, copyrights, logos, brand names, or other intellectual property mentioned or depicted on this site. Such intellectual property remains the property of its respective owners, and any references here are made solely for identification or informational purposes, without implying any affiliation, endorsement, or partnership.
We make no representations or warranties, express or implied, regarding the accuracy, completeness, or suitability of any content or products presented. Nothing on this website should be construed as legal, tax, investment, financial, medical, or other professional advice. In addition, no part of this site—including articles or product references—constitutes a solicitation, recommendation, endorsement, advertisement, or offer to buy or sell any securities, franchises, or other financial instruments, particularly in jurisdictions where such activity would be unlawful.
All content is of a general nature and may not address the specific circumstances of any individual or entity. It is not a substitute for professional advice or services. Any actions you take based on the information provided here are strictly at your own risk. You accept full responsibility for any decisions or outcomes arising from your use of this website and agree to release us from any liability in connection with your use of, or reliance upon, the content or products found herein.