
|
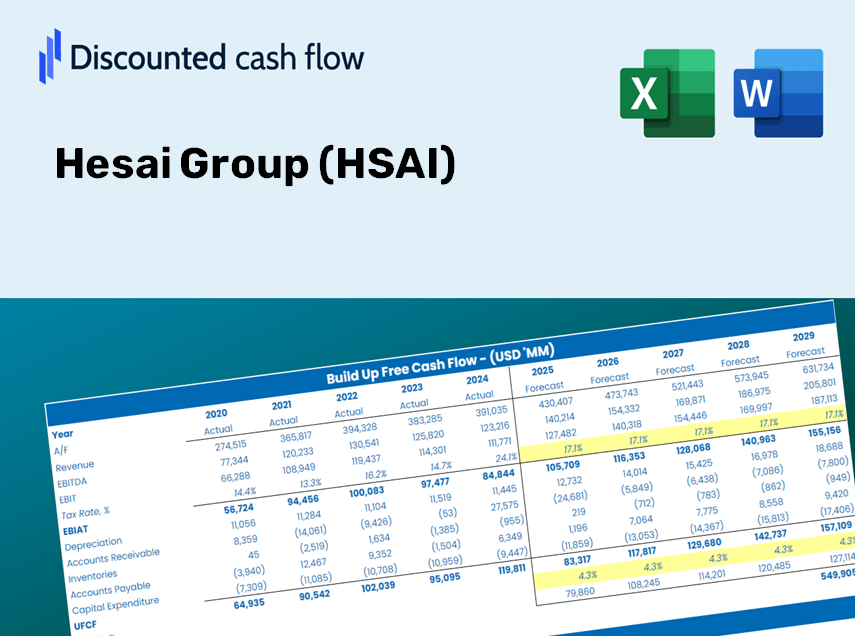
Hesai Group (HSAI) DCF Valuation |
Fully Editable: Tailor To Your Needs In Excel Or Sheets
Professional Design: Trusted, Industry-Standard Templates
Investor-Approved Valuation Models
MAC/PC Compatible, Fully Unlocked
No Expertise Is Needed; Easy To Follow
Hesai Group (HSAI) Bundle
Simplify Hesai Group (HSAI) valuation with this customizable DCF Calculator! Featuring real Hesai Group (HSAI) financials and adjustable forecast inputs, you can test scenarios and uncover Hesai Group (HSAI) fair value in minutes.
What You Can Expect
- Authentic Hesai Data: Comprehensive financials – encompassing revenue to EBIT – derived from actual and projected performance.
- Complete Customization: Modify all essential parameters (yellow cells) such as WACC, growth %, and tax rates.
- Instant Valuation Refreshes: Automatic recalculations to assess the effect of adjustments on Hesai's fair value.
- Flexible Excel Template: Designed for quick modifications, scenario analysis, and thorough projections.
- Effortless and Precise: Avoid the hassle of building models from the ground up while preserving accuracy and adaptability.
Key Features
- Advanced DCF Calculator: Offers comprehensive unlevered and levered DCF valuation models tailored for Hesai Group (HSAI).
- WACC Calculator: Features a pre-configured Weighted Average Cost of Capital sheet with customizable parameters.
- Editable Forecast Assumptions: Easily adjust growth rates, capital expenditures, and discount rates as per your analysis needs.
- Built-In Financial Ratios: Evaluate profitability, leverage, and efficiency ratios specifically for Hesai Group (HSAI).
- Dashboard and Charts: Visual representations provide a clear summary of key valuation metrics for simplified analysis.
How It Functions
- Step 1: Download the Hesai Group (HSAI) Excel file.
- Step 2: Examine the pre-filled historical and projected data for Hesai Group.
- Step 3: Modify key assumptions (highlighted in yellow) according to your analysis.
- Step 4: Observe the automatic recalculations of Hesai Group's intrinsic value.
- Step 5: Utilize the results for investment decisions or reporting purposes.
Why Opt for Hesai Group's (HSAI) Calculator?
- Precision: Utilizes real Hesai Group financial data to ensure accuracy.
- Versatility: Built for users to easily test and modify their inputs.
- Efficiency: Avoid the complexities of creating a DCF model from the ground up.
- Expert-Grade: Crafted with the precision and ease-of-use suitable for CFOs.
- Intuitive: Designed to be user-friendly, even for individuals without extensive financial modeling expertise.
Who Can Benefit from This Product?
- Investors: Evaluate Hesai Group's valuation prior to buying or selling shares (HSAI).
- CFOs and Financial Analysts: Enhance valuation workflows and validate financial projections.
- Startup Founders: Discover how large public firms like Hesai Group are appraised in the market (HSAI).
- Consultants: Provide comprehensive valuation reports for your clientele.
- Students and Educators: Utilize real-time data to learn and teach valuation methodologies.
Contents of the Template
- Pre-Filled DCF Model: Hesai Group’s financial data preloaded for immediate application.
- WACC Calculator: Comprehensive calculations for Weighted Average Cost of Capital.
- Financial Ratios: Assess Hesai Group's profitability, leverage, and efficiency metrics.
- Editable Inputs: Adjust assumptions including growth rates, margins, and CAPEX to suit your scenarios.
- Financial Statements: Annual and quarterly reports to facilitate in-depth analysis.
- Interactive Dashboard: Effortlessly visualize essential valuation metrics and outcomes.
Disclaimer
All information, articles, and product details provided on this website are for general informational and educational purposes only. We do not claim any ownership over, nor do we intend to infringe upon, any trademarks, copyrights, logos, brand names, or other intellectual property mentioned or depicted on this site. Such intellectual property remains the property of its respective owners, and any references here are made solely for identification or informational purposes, without implying any affiliation, endorsement, or partnership.
We make no representations or warranties, express or implied, regarding the accuracy, completeness, or suitability of any content or products presented. Nothing on this website should be construed as legal, tax, investment, financial, medical, or other professional advice. In addition, no part of this site—including articles or product references—constitutes a solicitation, recommendation, endorsement, advertisement, or offer to buy or sell any securities, franchises, or other financial instruments, particularly in jurisdictions where such activity would be unlawful.
All content is of a general nature and may not address the specific circumstances of any individual or entity. It is not a substitute for professional advice or services. Any actions you take based on the information provided here are strictly at your own risk. You accept full responsibility for any decisions or outcomes arising from your use of this website and agree to release us from any liability in connection with your use of, or reliance upon, the content or products found herein.