
|
Housing and Urban Development Corporation Limited (HUDCO.NS) DCF Valuation |
Fully Editable: Tailor To Your Needs In Excel Or Sheets
Professional Design: Trusted, Industry-Standard Templates
Investor-Approved Valuation Models
MAC/PC Compatible, Fully Unlocked
No Expertise Is Needed; Easy To Follow
Housing and Urban Development Corporation Limited (HUDCO.NS) Bundle
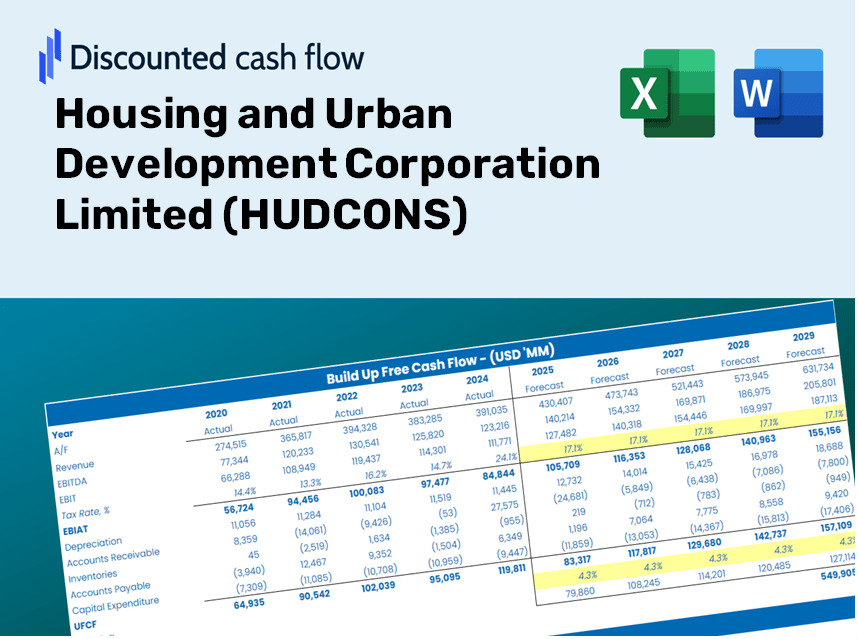
Whether you’re an investor or an analyst, this (HUDCONS) DCF Calculator is your go-to resource for accurate valuation. Equipped with real data from Housing and Urban Development Corporation Limited, you can adjust forecasts and instantly observe the effects.
Discounted Cash Flow (DCF) - (USD MM)
| Year | AY1 2021 |
AY2 2022 |
AY3 2023 |
AY4 2024 |
AY5 2025 |
FY1 2026 |
FY2 2027 |
FY3 2028 |
FY4 2029 |
FY5 2030 |
|---|---|---|---|---|---|---|---|---|---|---|
| Revenue | 72,627.8 | 69,844.3 | 70,776.5 | 31,775.2 | 103,457.2 | 114,423.0 | 126,551.0 | 139,964.5 | 154,799.8 | 171,207.5 |
| Revenue Growth, % | 0 | -3.83 | 1.33 | -55.1 | 225.59 | 10.6 | 10.6 | 10.6 | 10.6 | 10.6 |
| EBITDA | 71,838.6 | 69,348.5 | 68,504.9 | 78,500.3 | 32,860.7 | 97,661.5 | 108,012.9 | 119,461.6 | 132,123.7 | 146,127.9 |
| EBITDA, % | 98.91 | 99.29 | 96.79 | 247.05 | 31.76 | 85.35 | 85.35 | 85.35 | 85.35 | 85.35 |
| Depreciation | 60.9 | 70.4 | 105.0 | 98.6 | 106.4 | 170.8 | 188.9 | 208.9 | 231.0 | 255.5 |
| Depreciation, % | 0.08385219 | 0.1008 | 0.14835 | 0.3103 | 0.10284 | 0.14923 | 0.14923 | 0.14923 | 0.14923 | 0.14923 |
| EBIT | 71,777.7 | 69,278.1 | 68,399.9 | 78,401.7 | 32,754.3 | 97,561.8 | 107,902.6 | 119,339.6 | 131,988.7 | 145,978.6 |
| EBIT, % | 98.83 | 99.19 | 96.64 | 246.74 | 31.66 | 85.26 | 85.26 | 85.26 | 85.26 | 85.26 |
| Total Cash | 14,280.4 | 6,446.4 | 143.2 | 3,873.6 | 645.4 | 9,590.7 | 10,607.2 | 11,731.5 | 12,975.0 | 14,350.2 |
| Total Cash, percent | .0 | .0 | .0 | .0 | .0 | .0 | .0 | .0 | .0 | .0 |
| Account Receivables | 4,797.8 | 5,741.2 | 5,966.6 | 6,310.4 | 41.8 | 9,876.1 | 10,922.9 | 12,080.7 | 13,361.1 | 14,777.3 |
| Account Receivables, % | 6.61 | 8.22 | 8.43 | 19.86 | 0.04040318 | 8.63 | 8.63 | 8.63 | 8.63 | 8.63 |
| Inventories | .0 | 7,125.9 | 6,636.0 | .0 | .0 | 4,480.5 | 4,955.4 | 5,480.6 | 6,061.5 | 6,704.0 |
| Inventories, % | 0 | 10.2 | 9.38 | 0 | 0 | 3.92 | 3.92 | 3.92 | 3.92 | 3.92 |
| Accounts Payable | 13,931.3 | 11,607.1 | 9,341.4 | 9,019.6 | .0 | 17,709.1 | 19,586.2 | 21,662.1 | 23,958.2 | 26,497.6 |
| Accounts Payable, % | 19.18 | 16.62 | 13.2 | 28.39 | 0 | 15.48 | 15.48 | 15.48 | 15.48 | 15.48 |
| Capital Expenditure | -108.3 | -64.1 | -22.7 | -41.8 | -217.4 | -140.7 | -155.6 | -172.1 | -190.3 | -210.5 |
| Capital Expenditure, % | -0.14912 | -0.09177556 | -0.03207279 | -0.13155 | -0.21014 | -0.12293 | -0.12293 | -0.12293 | -0.12293 | -0.12293 |
| Tax Rate, % | 25.5 | 25.5 | 25.5 | 25.5 | 25.5 | 25.5 | 25.5 | 25.5 | 25.5 | 25.5 |
| EBITAT | 50,838.7 | 50,687.4 | 50,833.0 | 58,364.2 | 24,400.4 | 71,658.8 | 79,254.1 | 87,654.5 | 96,945.3 | 107,220.8 |
| Depreciation | ||||||||||
| Changes in Account Receivables | ||||||||||
| Changes in Inventories | ||||||||||
| Changes in Accounts Payable | ||||||||||
| Capital Expenditure | ||||||||||
| UFCF | 59,924.8 | 40,300.2 | 48,914.1 | 64,391.4 | 21,538.4 | 75,083.2 | 79,642.7 | 88,084.3 | 97,420.6 | 107,746.6 |
| WACC, % | 5.61 | 5.72 | 5.77 | 5.77 | 5.77 | 5.73 | 5.73 | 5.73 | 5.73 | 5.73 |
| PV UFCF | ||||||||||
| SUM PV UFCF | 376,315.0 | |||||||||
| Long Term Growth Rate, % | 2.00 | |||||||||
| Free cash flow (T + 1) | 109,901 | |||||||||
| Terminal Value | 2,948,301 | |||||||||
| Present Terminal Value | 2,231,667 | |||||||||
| Enterprise Value | 2,607,982 | |||||||||
| Net Debt | 1,072,322 | |||||||||
| Equity Value | 1,535,660 | |||||||||
| Diluted Shares Outstanding, MM | 2,002 | |||||||||
| Equity Value Per Share | 766.94 |
What You Will Receive
- Authentic HUDCONS Financials: Access comprehensive historical and projected data for precise valuation.
- Customizable Parameters: Adjust WACC, tax rates, revenue growth, and capital investments as needed.
- Real-Time Calculations: Intrinsic value and NPV are computed automatically.
- Scenario Exploration: Analyze various scenarios to forecast HUDCONS’s future performance.
- User-Friendly Design: Designed for industry experts while remaining approachable for newcomers.
Key Features
- Pre-Loaded Data: HUDCONS' historical financial statements and pre-filled forecasts.
- Fully Adjustable Inputs: Customize WACC, tax rates, revenue growth, and EBITDA margins.
- Instant Results: Witness HUDCONS' intrinsic value recalibrate in real time.
- Clear Visual Outputs: Dashboard charts present valuation results and essential metrics.
- Built for Accuracy: A professional tool designed for analysts, investors, and finance professionals.
How It Functions
- 1. Access the Template: Download and open the Excel file containing HUDCONS’ (HUDC) preloaded data.
- 2. Modify Assumptions: Adjust crucial inputs such as growth rates, WACC, and capital expenditures.
- 3. View Results Instantly: The DCF model automatically calculates intrinsic value and NPV in real-time.
- 4. Explore Scenarios: Evaluate different forecasts to examine various valuation results.
- 5. Present with Assurance: Share professional valuation insights to enhance your decision-making process.
Why Opt for HUDCONS' Calculator?
- Designed for Experts: A sophisticated tool tailored for urban planners, developers, and financial analysts.
- Accurate Data: Historical and projected financial information for HUDCONS preloaded for reliable analysis.
- Forecast Simulation: Effortlessly test various scenarios and assumptions.
- Clear Results: Automatically computes intrinsic value, NPV, and essential metrics.
- User-Friendly: Step-by-step guidance ensures a smooth experience.
Who Can Benefit from HUDCONS?
- Real Estate Investors: Assess HUDCONS’ valuation before making investment decisions.
- Financial Officers and Analysts: Optimize valuation methodologies and validate financial forecasts.
- Property Developers: Discover how established firms like HUDCONS are valued in the market.
- Consultants: Provide expert valuation analyses and reports for your clients.
- Students and Educators: Utilize up-to-date data to practice and instruct on valuation principles.
Contents of the HUDCONS Template
- Detailed DCF Model: An editable template that includes extensive valuation calculations.
- In-Depth Financial Data: Historical and projected financial information for HUDCONS is preloaded for your analysis.
- Flexible Parameters: Modify WACC, growth rates, and tax assumptions to explore various scenarios.
- Comprehensive Financial Statements: Annual and quarterly financials for enhanced insights.
- Essential Ratios: Integrated analysis for assessing profitability, efficiency, and financial leverage.
- Visual Dashboard: Interactive charts and tables to present clear, actionable insights.
Disclaimer
All information, articles, and product details provided on this website are for general informational and educational purposes only. We do not claim any ownership over, nor do we intend to infringe upon, any trademarks, copyrights, logos, brand names, or other intellectual property mentioned or depicted on this site. Such intellectual property remains the property of its respective owners, and any references here are made solely for identification or informational purposes, without implying any affiliation, endorsement, or partnership.
We make no representations or warranties, express or implied, regarding the accuracy, completeness, or suitability of any content or products presented. Nothing on this website should be construed as legal, tax, investment, financial, medical, or other professional advice. In addition, no part of this site—including articles or product references—constitutes a solicitation, recommendation, endorsement, advertisement, or offer to buy or sell any securities, franchises, or other financial instruments, particularly in jurisdictions where such activity would be unlawful.
All content is of a general nature and may not address the specific circumstances of any individual or entity. It is not a substitute for professional advice or services. Any actions you take based on the information provided here are strictly at your own risk. You accept full responsibility for any decisions or outcomes arising from your use of this website and agree to release us from any liability in connection with your use of, or reliance upon, the content or products found herein.