
|
Hawkins, Inc. (HWKN): 5 FORCES Analysis [Nov-2025 Updated] |
Fully Editable: Tailor To Your Needs In Excel Or Sheets
Professional Design: Trusted, Industry-Standard Templates
Investor-Approved Valuation Models
MAC/PC Compatible, Fully Unlocked
No Expertise Is Needed; Easy To Follow
Hawkins, Inc. (HWKN) Bundle
You're digging into the real competitive moat around this specialty chemical and water treatment firm as of late 2025, and honestly, mapping out the near-term risks and opportunities requires a sharp look through Michael Porter's Five Forces. We've seen the company hit record annual sales of $974.4 million in fiscal 2025, which is great, but what does that tell us about the underlying structure? We'll break down how their massive distribution footprint-with 64 facilities across 28 states-helps fend off new players, while also weighing the intense rivalry and supplier pressures. For instance, knowing that no single customer hits the 10% sales mark is key to assessing buyer power, so stick around to see the full, precise analysis below.
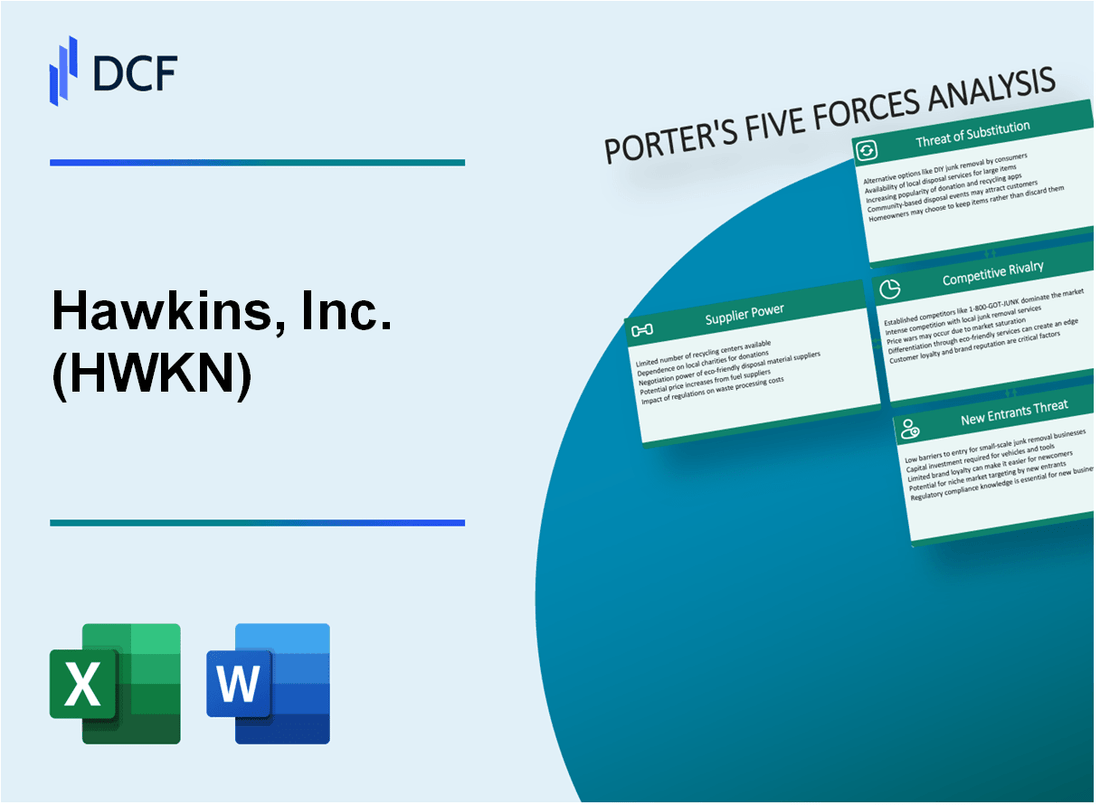
Hawkins, Inc. (HWKN) - Porter's Five Forces: Bargaining power of suppliers
When you look at Hawkins, Inc.'s supply chain, the power held by their raw material providers is a key lever affecting profitability. Raw material price volatility directly impacts margins, especially if price increases cannot be immediately passed through to customers. We saw this dynamic play out in the Industrial segment during fiscal 2025. For instance, in the third quarter of fiscal 2025, Industrial segment sales were $92.0 million. The gross profit for that quarter was $15.2 million, representing a margin of 17% of sales, down from 18% of sales in the prior year period. This margin compression was explicitly linked to lower selling prices driven by lower raw material costs and product mix changes. To be fair, the reverse is also true: if raw material costs spike, Hawkins, Inc. must quickly adjust its own pricing to maintain that margin, or its profitability suffers.
Dependency on major chemical producers for raw materials creates inherent supply chain risk for Hawkins, Inc. This is a standard consideration for any specialty chemical formulator. However, the company actively mitigates this risk. Hawkins, Inc. sources its health and nutrition ingredients from a wide array of domestic and international vendors. Furthermore, the company states it has numerous suppliers, including many of the major chemical producers in the United States. This diversification is a critical defense against single-source failure or undue pricing pressure from one large entity.
Suppliers' power is mitigated by Hawkins, Inc.'s use of numerous vendors, domestically and internationally. This broad sourcing strategy helps keep any single supplier from gaining too much leverage over the company, which generated $974 million in revenue in fiscal 2025. The physical footprint also supports this: Hawkins, Inc. operates 64 facilities across 28 states, suggesting a decentralized purchasing and distribution network that can potentially pivot sourcing based on regional availability or cost.
A supply disruption, even with diversified sourcing, could prevent the company from manufacturing products for customers. Consider the scale of operations: the Industrial segment alone posted sales of $103.2 million in the first quarter of fiscal 2025. A failure to secure a key input could halt production across multiple lines. Here's the quick math on how raw material costs translate to the top line; for the three months ended June 29, 2025 (Q1 FY2026), the consolidated Cost of Sales - materials was $197,821 (in thousands, or $197.8 million) against total sales of $293,272 (in thousands, or $293.3 million).
Here is a look at the cost structure related to materials for the first quarter of fiscal 2026:
| Metric (Three Months Ended June 29, 2025) | Value (in thousands USD) | Percentage of Total Sales |
|---|---|---|
| Total Sales | 293,272 | 100.0% |
| Cost of Sales - Materials | 197,821 | 67.5% |
| Cost of Sales - Operational Overhead | 23,089 | 7.9% |
| Gross Profit | 72,362 | 24.7% |
The reliance on materials, which accounted for nearly 67.5% of the cost of sales in Q1 FY2026, underscores why supplier relationships are vital. The key mitigation factors for Hawkins, Inc. include:
- Sourcing from a wide array of vendors.
- Maintaining distributorship agreements or supply contracts.
- Utilizing many major US chemical producers.
- Leveraging a broad physical footprint across 28 states.
- Offering custom toll blending to potentially use diverse inputs.
Hawkins, Inc. (HWKN) - Porter's Five Forces: Bargaining power of customers
You're analyzing Hawkins, Inc.'s customer power, and the first thing that jumps out is the lack of reliance on any single buyer. This is a strong position to be in, frankly. For the full fiscal year 2025, which ended March 30, 2025, the company reported record annual sales of $974.4 million. Right here, we see the core strength:
- Customer concentration is low, with no single customer accounting for 10% or more of fiscal 2025 sales.
This low concentration means that losing any one account, even a large one, won't derail the entire operation. It definitely gives Hawkins, Inc. leverage in price negotiations compared to a supplier with one or two major buyers.
The B2B model Hawkins, Inc. employs naturally mitigates buyer power because the focus isn't just on selling a commodity chemical. Instead, the company centers on specialized, value-added services and product formulation. For instance, the Industrial Solutions group often performs custom blending of chemicals according to specific customer formulas and specifications. This moves the relationship beyond simple transactional purchasing.
To give you a clearer picture of the customer base diversity, here is the revenue breakdown across Hawkins, Inc.'s operating segments for fiscal 2025:
| Segment | Fiscal 2025 Sales (Millions USD) |
| Water Treatment | $446.5 |
| Industrial Solutions | $382.5 |
| Health & Nutrition | $145.5 |
This table shows that the largest segment, Water Treatment, still only accounted for about 45.8% of total sales ($446.5M / $974.4M), confirming that no single customer is a dominant force.
Still, you can't assume buyers have zero power. Customers have moderate power due to the availability of equivalent products from competitors. Hawkins, Inc. itself notes they compete with 'many producers, distributors and sales agents offering products equivalent to substantially all of the products we offer.' If a customer is only buying a standard, off-the-shelf chemical, their ability to switch based on price is definitely higher.
However, the balance shifts when you look at the complexity of the offering. High switching costs exist for complex water treatment and ingredient formulation customers. When Hawkins, Inc. is performing custom blending or providing integrated solutions-like the combined equipment and chemical offering for water treatment customers following recent acquisitions-the cost and effort for a buyer to re-engineer their process with a new supplier rise significantly. The company supports its 64 facilities across 28 states with this specialized service model, which builds customer dependence. If a product fails to meet requirements, the customer could seek replacement or damages, but for mission-critical applications, the established supply chain and technical support act as a strong deterrent to switching.
Hawkins, Inc. (HWKN) - Porter's Five Forces: Competitive rivalry
The competitive rivalry within Hawkins, Inc.'s operating markets is definitely intense. You're looking at a landscape populated by numerous producers and distributors, and this includes much larger, global entities like Univar Solutions, which, for context, reported revenues in the billions in recent years, such as $11.47B in 2022. That scale difference means Hawkins, Inc. can't just compete on price alone; it has to be sharper elsewhere.
We saw direct evidence of this pricing tension in the most recent reporting periods. Specifically, management noted competitive pricing pressures impacting gross profit in the Food & Health Sciences segment during Q1 Fiscal Year 2026. Similarly, the Industrial Solutions segment also saw its gross profit decrease in Q1 FY2026, partly due to these same competitive pricing pressures, alongside increased operating costs. Even in Q2 FY2026, Food & Health Sciences margins were noted as facing pressure from competitive pricing.
To counter this, Hawkins, Inc. leans heavily on differentiation, which is a smart move when facing volume giants. The company's value proposition isn't just the chemical itself; it's the whole package. They compete on:
- Superb customer service and support.
- Deep technical expertise.
- Consistent product quality.
This focus on service and quality is how they create value for customers across their Water Treatment, Food & Health Sciences, and Industrial Solutions segments. It's about being the reliable partner, not just the lowest bidder. This approach seems to be working, as the company posted record annual sales of $974.4 million in fiscal 2025, which shows they are effectively defending their market position despite the competitive environment.
Here's a quick look at how the top-line performance in fiscal 2025 demonstrated that market defense, especially when you consider the growth in the core Water Treatment business:
| Metric | Fiscal Year 2025 Amount | Comparison to Prior Year |
| Record Annual Sales | $974.4 million | Up 6% |
| Water Treatment Segment Sales | $446.5 million | Up 23% |
| Industrial Solutions Sales | $382.5 million | Down 7% |
| Health and Nutrition Sales | $145.5 million | Down 1% |
The fact that the overall revenue grew by 6% to reach $974.4 million in FY2025, while the Industrial segment faced headwinds and the company was integrating acquisitions, suggests strong underlying demand and effective competitive positioning in the Water Treatment area, which grew sales by 23% to $446.5 million.
The company's physical footprint also supports its service-based competitive edge. As of the Q2 FY2026 reporting, Hawkins, Inc. operates 64 facilities across 28 states. This domestic network allows for the nimble and personalized problem-solving that management emphasizes, which is a key differentiator against less localized competitors.
Hawkins, Inc. (HWKN) - Porter's Five Forces: Threat of substitutes
Customers may find alternative materials or processes that eliminate the need for Hawkins, Inc.'s products. This is a constant pressure point, especially where product differentiation is less pronounced or where competitors deploy more aggressive pricing or superior technology. For instance, in the broader chemical and ingredients space, competitors with advanced technologies could pose a threat to Hawkins, Inc.'s market share, requiring vigilance in maintaining product relevance.
To illustrate the current strength in the segment most insulated from this threat, look at the recent performance of the Water Treatment business, which is heavily reliant on critical inputs and service:
| Metric | Period Ended | Value | Year-over-Year Change |
|---|---|---|---|
| Water Treatment Segment Sales | Q3 Fiscal 2025 | $99.8 million | 22% increase |
| Water Treatment Segment Sales | Q1 Fiscal 2026 | $149.6 million | 28% increase |
| Water Treatment Segment Sales | Q2 Fiscal 2026 | $150.9 million | 21% increase |
| Consolidated Revenue | Fiscal Year 2025 | $974 million | N/A |
| Consolidated Revenue | Q2 Fiscal 2026 | $280.4 million | 14% increase |
The threat is low in the Water Treatment segment due to critical products and high-touch service model. You see this reflected in the consistent, double-digit growth rates; for example, Water Treatment sales grew 21% in the second quarter of fiscal 2026 compared to the prior year period. When products are essential for regulatory compliance or core operations, switching costs-both in terms of process change and service disruption-rise significantly, effectively lowering the substitute threat for Hawkins, Inc. in this area.
Continuous new product development is required to replace sales of mature or declining products. This necessity is baked into the company's stated mission to supply quality products and innovative solutions with exceptional service. You need to keep an eye on R&D focus areas, as stagnation invites substitution. Key areas driving this need include:
- Investing in new capabilities as part of the growth strategy.
- Expanding current markets with new offerings.
- Growing new markets through innovation.
- Maintaining a competitive edge against advanced technologies.
Hawkins, Inc. (HWKN) - Porter's Five Forces: Threat of new entrants
For you, as a financial analyst looking at Hawkins, Inc., the threat of new entrants isn't a simple yes or no question; it's a matter of how high the walls are built. Honestly, for a company like Hawkins, Inc., those walls are quite substantial, built from physical assets, regulatory hurdles, and deep customer history. New competition doesn't just need a good idea; they need serious infrastructure and proven compliance.
Barriers to entry are created by the need for extensive distribution networks. Hawkins, Inc. has already solved this massive logistical puzzle, operating 64 facilities in 28 states as of late 2025. Think about what that means for a newcomer: they would need to replicate this footprint just to offer competitive delivery times and service reach across the country. That scale is a huge upfront cost before you even sell your first drum of chemical.
High capital investment is required for manufacturing, blending, and compliance processes. This isn't just about buying equipment; it's about meeting stringent environmental, health, and safety regulations across multiple jurisdictions. Hawkins, Inc. reported $974 million in revenue for fiscal 2025, showing the scale of operations that require this capital base. The ongoing costs for compliance alone act as a major deterrent for smaller players.
Strong customer relationships and technical expertise create an effective barrier. Hawkins, Inc. competes by coupling quality products with outstanding customer service and value-added services, including product formulation where needed. When you have approximately 1,100 employees supporting this effort, you build trust that takes years to earn. Customers in water treatment, for instance, rely on consistent, expert support, which is hard to displace.
Strategic acquisitions, like the four completed in fiscal 2025, increase market density and scale, defintely raising the hurdle for newcomers. These weren't small deals; the aggregate annual revenue of these four businesses acquired in fiscal 2025 totaled approximately $67 million. This aggressive, targeted M&A strategy immediately absorbs smaller potential competitors or bolsters Hawkins, Inc.'s position in key geographic areas, making it harder for a new entrant to carve out a viable niche. It's a clear signal that market share is being consolidated.
Here's a quick look at the scale that new entrants face:
| Metric | Value for Hawkins, Inc. (Late 2025) |
| Total Facilities | 64 |
| States Served | 28 |
| Fiscal 2025 Revenue | $974 million |
| Acquisitions Completed in Fiscal 2025 | 4 |
| Aggregate Revenue of FY2025 Acquisitions | Approximately $67 million |
The combination of physical assets and strategic financial moves means the barrier to entry is high, but not insurmountable for a well-capitalized entity. Still, you're not just competing against Hawkins, Inc.; you're competing against their entire established network.
You should look closely at the Water Treatment segment, as that's where most of the recent acquisition activity was focused. The integration of acquired businesses, like WaterSurplus post-fiscal year-end, adds capabilities in design, engineering, and filtration systems, further complicating the competitive landscape for any new firm trying to enter that specific value chain.
Finance: review the capital expenditure breakdown from the Q3 2026 filings to see if CapEx spending on facility upgrades is keeping pace with the growth in the number of locations.
Disclaimer
All information, articles, and product details provided on this website are for general informational and educational purposes only. We do not claim any ownership over, nor do we intend to infringe upon, any trademarks, copyrights, logos, brand names, or other intellectual property mentioned or depicted on this site. Such intellectual property remains the property of its respective owners, and any references here are made solely for identification or informational purposes, without implying any affiliation, endorsement, or partnership.
We make no representations or warranties, express or implied, regarding the accuracy, completeness, or suitability of any content or products presented. Nothing on this website should be construed as legal, tax, investment, financial, medical, or other professional advice. In addition, no part of this site—including articles or product references—constitutes a solicitation, recommendation, endorsement, advertisement, or offer to buy or sell any securities, franchises, or other financial instruments, particularly in jurisdictions where such activity would be unlawful.
All content is of a general nature and may not address the specific circumstances of any individual or entity. It is not a substitute for professional advice or services. Any actions you take based on the information provided here are strictly at your own risk. You accept full responsibility for any decisions or outcomes arising from your use of this website and agree to release us from any liability in connection with your use of, or reliance upon, the content or products found herein.