
|
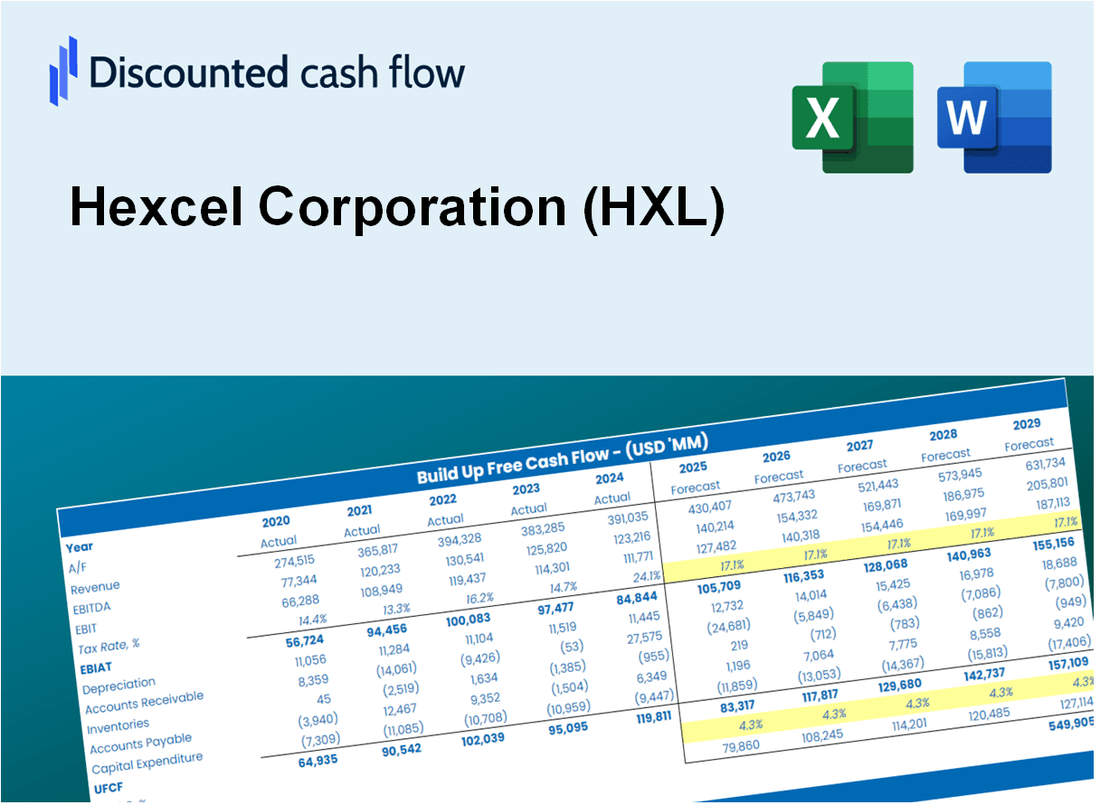
Hexcel Corporation (HXL) DCF Valuation |
Fully Editable: Tailor To Your Needs In Excel Or Sheets
Professional Design: Trusted, Industry-Standard Templates
Investor-Approved Valuation Models
MAC/PC Compatible, Fully Unlocked
No Expertise Is Needed; Easy To Follow
Hexcel Corporation (HXL) Bundle
Streamline your analysis and improve precision with our (HXL) DCF Calculator! Equipped with real Hexcel Corporation data and customizable assumptions, this tool empowers you to forecast, evaluate, and value (HXL) just like a seasoned investor.
What You Will Get
- Editable Excel Template: A fully customizable Excel-based DCF Calculator featuring pre-filled real HXL financials.
- Real-World Data: Historical data and forward-looking estimates (as shown in the highlighted cells).
- Forecast Flexibility: Adjust forecast assumptions such as revenue growth, EBITDA %, and WACC.
- Automatic Calculations: Instantly observe the impact of your inputs on Hexcel Corporation’s valuation.
- Professional Tool: Designed for investors, CFOs, consultants, and financial analysts.
- User-Friendly Design: Organized for clarity and ease of use, complete with step-by-step instructions.
Key Features
- Comprehensive DCF Model: Features both unlevered and levered DCF valuation frameworks tailored for Hexcel Corporation (HXL).
- WACC Estimator: Pre-configured Weighted Average Cost of Capital calculator with adjustable parameters.
- Customizable Forecast Inputs: Adjust growth projections, capital expenditures, and discount rates as needed.
- Integrated Financial Ratios: Evaluate profitability, leverage, and efficiency metrics specific to Hexcel Corporation (HXL).
- Interactive Dashboard and Graphs: Visual representations of essential valuation indicators for streamlined analysis.
How It Works
- Download the Template: Gain immediate access to the Excel-based HXL DCF Calculator.
- Input Your Assumptions: Modify the yellow-highlighted cells for growth rates, WACC, margins, and other variables.
- Instant Calculations: The model automatically recalculates Hexcel’s intrinsic value.
- Test Scenarios: Experiment with different assumptions to see how they impact valuation outcomes.
- Analyze and Decide: Leverage the results to inform your investment or financial strategy.
Why Choose This Calculator for Hexcel Corporation (HXL)?
- All-in-One Solution: Features DCF, WACC, and financial ratio analyses tailored for Hexcel Corporation.
- Flexible Inputs: Modify the highlighted cells to explore different financial scenarios for (HXL).
- In-Depth Analysis: Automatically computes Hexcel's intrinsic value and Net Present Value.
- Loaded with Data: Access historical and projected data to ensure reliable calculations.
- High-Quality Standards: Perfect for financial analysts, investors, and business consultants focused on (HXL).
Who Should Use This Product?
- Professional Investors: Develop comprehensive and accurate valuation models for analyzing Hexcel Corporation (HXL) investments.
- Corporate Finance Teams: Evaluate valuation scenarios to inform strategic decisions within the organization.
- Consultants and Advisors: Deliver precise valuation insights to clients interested in Hexcel Corporation (HXL) stock.
- Students and Educators: Utilize real-world data to enhance learning and practice in financial modeling.
- Aerospace and Composite Material Enthusiasts: Gain insights into how companies like Hexcel Corporation (HXL) are valued in the industry.
What the Template Contains
- Preloaded HXL Data: Historical and projected financial data, including revenue, EBIT, and capital expenditures.
- DCF and WACC Models: Professional-grade sheets for calculating intrinsic value and Weighted Average Cost of Capital.
- Editable Inputs: Yellow-highlighted cells for adjusting revenue growth, tax rates, and discount rates.
- Financial Statements: Comprehensive annual and quarterly financials for deeper analysis.
- Key Ratios: Profitability, leverage, and efficiency ratios to evaluate performance.
- Dashboard and Charts: Visual summaries of valuation outcomes and assumptions.
Disclaimer
All information, articles, and product details provided on this website are for general informational and educational purposes only. We do not claim any ownership over, nor do we intend to infringe upon, any trademarks, copyrights, logos, brand names, or other intellectual property mentioned or depicted on this site. Such intellectual property remains the property of its respective owners, and any references here are made solely for identification or informational purposes, without implying any affiliation, endorsement, or partnership.
We make no representations or warranties, express or implied, regarding the accuracy, completeness, or suitability of any content or products presented. Nothing on this website should be construed as legal, tax, investment, financial, medical, or other professional advice. In addition, no part of this site—including articles or product references—constitutes a solicitation, recommendation, endorsement, advertisement, or offer to buy or sell any securities, franchises, or other financial instruments, particularly in jurisdictions where such activity would be unlawful.
All content is of a general nature and may not address the specific circumstances of any individual or entity. It is not a substitute for professional advice or services. Any actions you take based on the information provided here are strictly at your own risk. You accept full responsibility for any decisions or outcomes arising from your use of this website and agree to release us from any liability in connection with your use of, or reliance upon, the content or products found herein.