
|
Itissalat Al-Maghrib S.A. (IAM.PA) DCF Valuation |
Fully Editable: Tailor To Your Needs In Excel Or Sheets
Professional Design: Trusted, Industry-Standard Templates
Investor-Approved Valuation Models
MAC/PC Compatible, Fully Unlocked
No Expertise Is Needed; Easy To Follow
Itissalat Al-Maghrib (IAM) S.A. (IAM.PA) Bundle
Discover the true potential of Itissalat Al-Maghrib (IAM) S.A. (IAMPA) with our advanced DCF Calculator! Adjust key assumptions, explore various scenarios, and evaluate how different changes affect the valuation of Itissalat Al-Maghrib (IAM) S.A. (IAMPA) – all within one comprehensive Excel template.
What You Will Receive
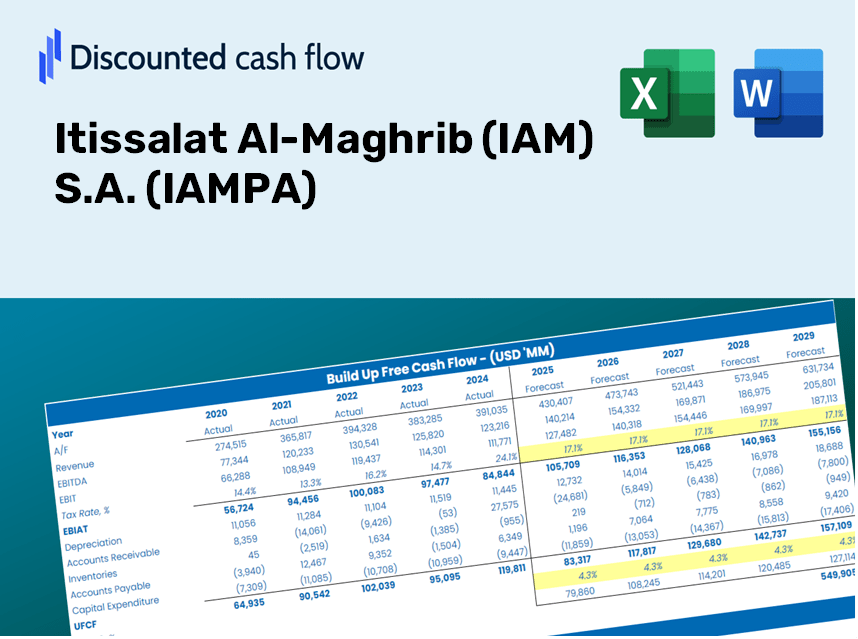
- Authentic IAM Data: Preloaded financials – encompassing revenue to EBIT – derived from actual and projected figures.
- Complete Customization: Modify all key parameters (yellow cells) such as WACC, growth %, and tax rates.
- Immediate Valuation Updates: Automatic recalibrations to evaluate the effects of changes on IAM’s fair value.
- Flexible Excel Template: Designed for quick adjustments, scenario analysis, and comprehensive forecasting.
- Efficient and Accurate: Avoid the hassle of building models from the ground up while ensuring precision and adaptability.
Key Features
- Comprehensive DCF Calculator: Offers detailed unlevered and levered DCF valuation models tailored for Itissalat Al-Maghrib (IAM) S.A. (IAMPA).
- WACC Calculator: Features a pre-built Weighted Average Cost of Capital template with adjustable input parameters.
- Customizable Forecast Assumptions: Adjust growth rates, capital expenditures, and discount rates as needed.
- Integrated Financial Ratios: Evaluate profitability, leverage, and efficiency ratios specific to Itissalat Al-Maghrib (IAM) S.A. (IAMPA).
- Interactive Dashboard and Charts: Visual representations present key valuation metrics for straightforward analysis.
How It Works
- Step 1: Download the Excel file.
- Step 2: Examine the pre-filled financial data and projections for Itissalat Al-Maghrib (IAM) S.A. (IAMPA).
- Step 3: Adjust key inputs such as revenue growth, WACC, and tax rates (highlighted cells).
- Step 4: Observe the DCF model updating in real time as you modify your assumptions.
- Step 5: Review the outcomes and leverage the results for your investment strategies.
Why Opt for the IAMPA Calculator?
- Precision: Leveraging actual IAM financials to ensure data integrity.
- Versatility: Crafted for users to easily test and tweak inputs as needed.
- Efficiency: Avoid the complexities of constructing a DCF model from ground zero.
- CFO-Approved: Built with a focus on high-caliber accuracy and user experience.
- Intuitive Design: Simple to navigate, even for those lacking extensive financial modeling skills.
Who Should Consider This Product?
- Professional Investors: Develop comprehensive and accurate valuation models for portfolio management focused on IAMPA.
- Corporate Finance Teams: Evaluate valuation scenarios to inform strategic decision-making within the organization.
- Consultants and Advisors: Deliver precise valuation insights to clients regarding IAMPA shares.
- Students and Educators: Utilize real-time data to enhance learning and practice in financial modeling.
- Telecom Industry Enthusiasts: Gain insights into how companies like Itissalat Al-Maghrib (IAM) S.A. are valued within the telecommunications market.
Contents of the Template
- Preloaded IAM Data: Historical and projected financial information, including revenue, EBIT, and capital expenditures.
- DCF and WACC Models: Professional-grade sheets designed for calculating intrinsic value and Weighted Average Cost of Capital.
- Editable Inputs: Yellow-highlighted cells for customizing revenue growth, tax rates, and discount rates.
- Financial Statements: Detailed annual and quarterly financials for enhanced analysis.
- Key Ratios: Ratios for profitability, leverage, and efficiency to assess performance.
- Dashboard and Charts: Visual representations of valuation results and underlying assumptions.
Disclaimer
All information, articles, and product details provided on this website are for general informational and educational purposes only. We do not claim any ownership over, nor do we intend to infringe upon, any trademarks, copyrights, logos, brand names, or other intellectual property mentioned or depicted on this site. Such intellectual property remains the property of its respective owners, and any references here are made solely for identification or informational purposes, without implying any affiliation, endorsement, or partnership.
We make no representations or warranties, express or implied, regarding the accuracy, completeness, or suitability of any content or products presented. Nothing on this website should be construed as legal, tax, investment, financial, medical, or other professional advice. In addition, no part of this site—including articles or product references—constitutes a solicitation, recommendation, endorsement, advertisement, or offer to buy or sell any securities, franchises, or other financial instruments, particularly in jurisdictions where such activity would be unlawful.
All content is of a general nature and may not address the specific circumstances of any individual or entity. It is not a substitute for professional advice or services. Any actions you take based on the information provided here are strictly at your own risk. You accept full responsibility for any decisions or outcomes arising from your use of this website and agree to release us from any liability in connection with your use of, or reliance upon, the content or products found herein.