
|
Interactive Brokers Group, Inc. (IBKR): BCG Matrix [Dec-2025 Updated] |
Fully Editable: Tailor To Your Needs In Excel Or Sheets
Professional Design: Trusted, Industry-Standard Templates
Investor-Approved Valuation Models
MAC/PC Compatible, Fully Unlocked
No Expertise Is Needed; Easy To Follow
Interactive Brokers Group, Inc. (IBKR) Bundle
Honestly, looking at Interactive Brokers Group, Inc. (IBKR) through the BCG lens as of Q3 2025 shows a powerhouse that's still growing fast, but not everywhere. Your core business is clearly in the Stars quadrant, fueled by 32% client growth and surging stock trades, while the $757.5 billion in customer equity underpins a Cash Cow operation boasting an industry-leading 79% pretax profit margin. Still, you need to watch the Dogs, like that 7% drop in futures volume, and see if the 5x crypto surge can turn that Question Mark into a future Star before competitors cement their lead.
Background of Interactive Brokers Group, Inc. (IBKR)
You're looking at the foundation of Interactive Brokers Group, Inc. (IBKR), an automated global electronic broker that really focuses on technology to deliver better terms for its clients. Honestly, the firm's mission hasn't changed much since its start: compete on price, speed, product diversity, and advanced trading tools. As of January 2025, Interactive Brokers was starting its 48th year as a broker/dealer, boasting a consolidated equity capital of $19.5 billion.
The Chairman, Thomas Peterffy, founded Interactive Brokers Group, Inc., and today the firm conducts its broker/dealer business across more than 160 market destinations globally. They provide direct-access trade execution and clearing services to a sophisticated client base, which includes individual investors, active traders, hedge funds, financial advisors, and institutions. The sheer scale is impressive; Interactive Brokers Group and its affiliates were executing approximately 3,616,000 trades per day, based on data from early 2025.
Interactive Brokers Group, Inc. offers a unified platform for trading a wide variety of electronically traded products. You can trade stocks, options, futures, currencies, bonds, mutual funds, exchange traded funds (ETFs), precious metals, and cryptocurrencies. This broad offering is a key part of their competitive edge, especially with recent growth in their crypto trading platform. They are regulated by agencies like the SEC, FINRA, and the FCA, among others, and have a significant global presence with offices in places like the US, UK, Switzerland, and Asia.
Looking at the most recent performance figures we have, the third quarter of 2025, which ended September 30, 2025, showed continued expansion. Reported net revenues hit $1,655 million, with adjusted net revenues at $1,610 million. That quarter saw GAAP Diluted EPS come in at $0.59, while adjusted EPS was $0.57. The client base grew substantially, with customer accounts increasing 32% year-over-year to 4.13 million by the end of Q3 2025.
Client financial metrics also reflect this growth trajectory. Customer equity surged 40% year-over-year to $757.5 billion as of the end of September 2025. Plus, the firm declared a quarterly cash dividend of $0.08 per share in October 2025. To be fair, the second quarter of 2025 also showed strong underlying profitability, with the pretax profit margin reported at a robust 75%.
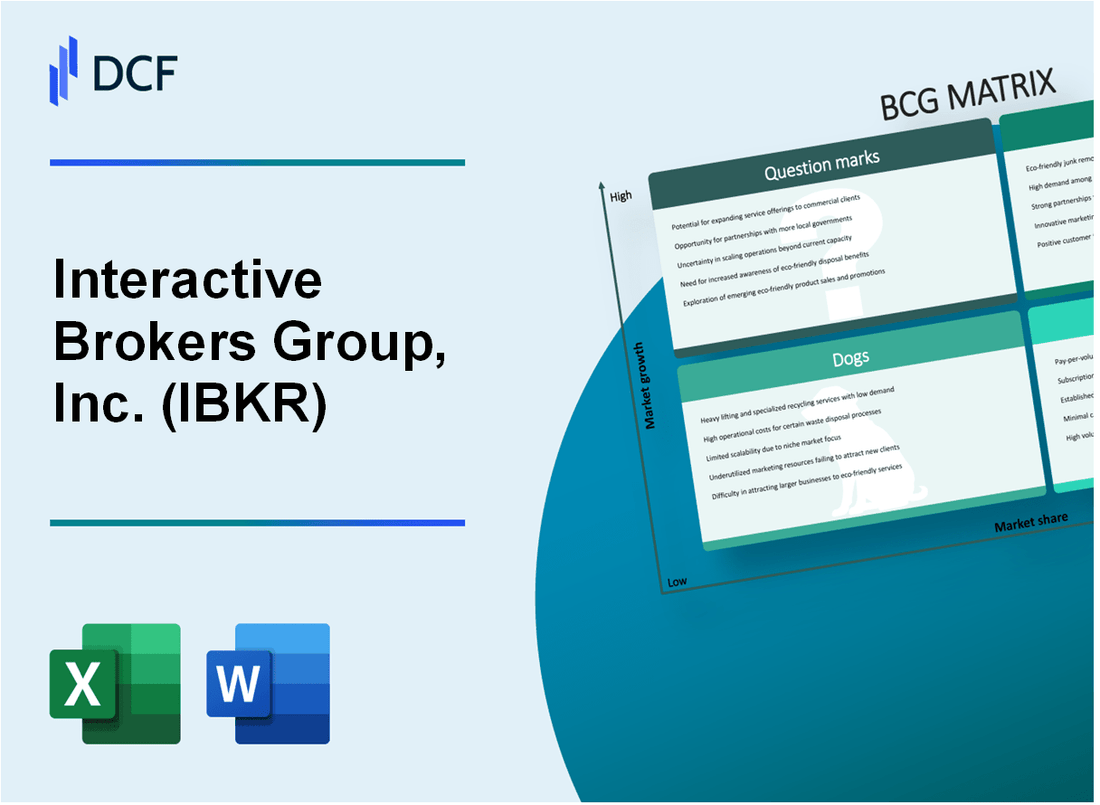
Interactive Brokers Group, Inc. (IBKR) - BCG Matrix: Stars
You're analyzing the core growth engines for Interactive Brokers Group, Inc. (IBKR) right now, the businesses that command high market share in rapidly expanding segments. These are the Stars in the BCG framework; they consume cash to maintain their lead but are essential for future Cash Cow status when market growth inevitably cools.
The sheer scale of client adoption and activity clearly places several areas of Interactive Brokers Group, Inc. (IBKR)'s business here. Consider the global client base, which is expanding at a clip that demands significant ongoing investment in infrastructure and compliance. Global client account growth increased 32% year-over-year to 4.13 million accounts as of Q3 2025. That's a massive influx of new users needing service.
This growth in accounts directly fuels trading activity, which is the lifeblood of the commission revenue stream. Commission revenue from high-volume traders was up 23% to $537 million in Q3 2025. Honestly, that number is impressive, especially considering the SEC fee rate reduction that occurred earlier in the year.
The trading volumes underpinning that revenue show where the market share strength lies. We see options and stock trading volumes surging 27% and 67% respectively in Q3 2025. Daily Average Revenue Trades (DARTs) hit 3.62 million, a 34% year-over-year increase, showing consistent daily engagement from this growing base.
Here's a quick look at how these key performance indicators stack up for the Star segment in Q3 2025:
| Metric | Value | Year-over-Year Change |
| Commission Revenue | $537 million | 23% increase |
| Global Client Accounts | 4.13 million | 32% increase |
| Daily Average Revenue Trades (DARTs) | 3.62 million | 34% increase |
| Stock Trading Volume | Not specified | 67% surge |
| Options Trading Volume | Not specified | 27% surge |
To be fair, the high growth in trading also drove significant increases in other revenue areas, reinforcing the Star positioning. Net revenues for the quarter reached $1.66 billion, up 21% from the previous year. Furthermore, customer equity, which represents the assets held by these active clients, increased 40% to $757.5 billion.
The operational efficiency in handling this volume is also a key indicator of market leadership. Interactive Brokers Group, Inc. (IBKR) achieved a pretax profit margin of 79% in the quarter. This high margin, coupled with the massive growth, means these units are generating significant cash, even while they require heavy investment to scale.
The digital asset space, while smaller, shows explosive growth that warrants Star classification based on market growth rate, even if market share is still being fought for:
- Crypto trade volumes surged 87% quarter-over-quarter.
- The company's competitive position strengthened, ranking #4 in Preqin Hedge Fund rankings.
- Net interest income increased 21% to $967 million.
If Interactive Brokers Group, Inc. (IBKR) can sustain this success until the overall market growth rate decelerates, these segments will transition into the Cash Cow quadrant, providing stable, high-margin returns. Finance: draft 13-week cash view by Friday.
Interactive Brokers Group, Inc. (IBKR) - BCG Matrix: Cash Cows
You're looking at the core engine of Interactive Brokers Group, Inc. (IBKR), the segment that generates far more cash than it needs to maintain its position. These are the established businesses with high market share in mature segments, and for Interactive Brokers Group, Inc., that stability is built on its massive client base and efficient operations.
The single largest revenue driver, Net Interest Income (NII), hit $967 million in Q3 2025. This figure, which rose 21% year-over-year, is a testament to the value locked in the client balances and the firm's ability to monetize them effectively. Honestly, seeing NII grow despite lower benchmark rates shows the power of scale here.
That scale is quantified by the customer equity balances, which provide a massive capital base of $757.5 billion as of Q3 2025. This enormous pool of client assets is the foundation that allows Interactive Brokers Group, Inc. to operate with such high profitability. It's the definition of a market leader providing the necessary fuel for the rest of the enterprise.
A key component supporting this cash generation is securities lending activity. This is a high-margin, automated revenue stream that directly drives the NII growth you see reported. Management noted that this activity, fueled by higher short activity and larger lendable inventory, was a standout driver for the quarter.
The result of this efficient operation is an industry-leading pretax profit margin of 79% in Q3 2025, both as reported and adjusted. That margin, up from 67% in the year-ago quarter, demonstrates operational efficiency that few competitors can match. It means for every dollar of revenue, Interactive Brokers Group, Inc. keeps a very large portion after covering operating costs.
To give you a clearer picture of the scale supporting these Cash Cow metrics, look at these key figures from the Q3 2025 report:
| Metric | Value (Q3 2025) |
| Net Interest Income (NII) | $967 million |
| Pretax Profit Margin | 79% |
| Customer Equity | $757.5 billion |
| Commission Revenue | $537 million |
| Total Daily Average Revenue Trades (DARTs) | 3.62 million |
The investments here aren't about flashy new market entry; they are about optimization. You want to invest in supporting infrastructure to keep that margin high and the service reliable. Here are some of the operational metrics that show the underlying strength:
- Customer accounts grew 32% year-over-year to 4.13 million.
- Commission revenue increased 23% to $537 million.
- Customer margin loans increased 39% to $77.3 billion.
- Customer credits increased 33% to $154.8 billion.
These Cash Cows are what fund the big bets on Question Marks and keep the lights on. Finance: draft the capital allocation plan prioritizing infrastructure efficiency upgrades by next Wednesday.
Interactive Brokers Group, Inc. (IBKR) - BCG Matrix: Dogs
You're looking at the segments of Interactive Brokers Group, Inc. (IBKR) that aren't driving growth or market share, the classic Dogs. These are units in markets that aren't expanding much, and frankly, Interactive Brokers Group, Inc. (IBKR) doesn't have a strong hold on them either. Expensive attempts to turn these around usually just drain resources; it's often better to minimize exposure here.
These units, by definition, have low market share and operate in low-growth arenas. They typically break even, meaning they neither generate significant cash nor consume a huge amount, but they tie up capital that could be better used elsewhere. Honestly, they are cash traps because capital is stuck in them for minimal return. Divestiture is the usual play for these business units.
We see this dynamic reflected in a few specific areas from the third quarter of 2025. For instance, futures trading volume saw a 7% decrease in Q3 2025, standing out against the strong performance in other asset classes. Also, the segment covering other fees and services declined 8% year-over-year, landing at $66 million for the quarter. This segment includes items like legacy risk exposure fees, which specifically decreased by $12 million in Q3 2025.
These low-volume, niche legacy products require maintenance, yet their contribution to the overall $1.61 billion in adjusted net revenue for the quarter is minimal. Here's the quick math: if adjusted net revenue was $1,610 million, these legacy areas are a small fraction, making their maintenance cost a drag on efficiency.
Here is a breakdown of the key financial metrics related to these underperforming areas for Q3 2025:
| Metric | Value (Q3 2025) | Change vs. Prior Year |
| Other Fees and Services Revenue | $66 million | Down 8% |
| Legacy Risk Exposure Fees (Component of Other Fees) | Not specified (Absolute Value) | Down $12 million |
| Futures Trading Volume | Not specified (Volume) | Down 7% |
| Adjusted Net Revenue (Context) | $1,610 million | Up 21% (Overall) |
You should review the specific product lines contributing to the 'Other fees and services' line item to isolate the true cash consumption. The areas that fit the Dog profile include:
- Futures trading volume, which is contracting at 7%.
- Legacy risk exposure fees, which dropped by $12 million.
- Other fees and services, which settled at $66 million.
- Niche products that don't move the needle on the $1.61 billion revenue base.
What this estimate hides is the exact operating expense tied to these specific legacy products, which is crucial for a divestiture decision. Finance: draft 13-week cash view by Friday.
Interactive Brokers Group, Inc. (IBKR) - BCG Matrix: Question Marks
Question Marks represent business units or products within Interactive Brokers Group, Inc. (IBKR) that operate in high-growth markets but currently hold a low relative market share. These areas consume cash as they require investment to scale but have not yet generated significant returns. The strategic imperative is to invest aggressively to capture market share or divest if the potential is not realized.
The following areas of Interactive Brokers Group, Inc. (IBKR) fit this profile as of 2025, characterized by significant investment in new markets or products where the ultimate market share is yet to be determined.
Cryptocurrency Trading
Interactive Brokers Group, Inc. (IBKR) is investing in the high-growth digital asset space, though its offering is currently narrow compared to specialized crypto exchanges. The platform has expanded its digital asset lineup to include tokens such as Chainlink (LINK), Avalanche (AVAX), and Sui (SUI), joining established assets like Bitcoin (BTC), Ethereum (ETH), Litecoin (LTC), Bitcoin Cash (BCH), Solana (SOL), Cardano (ADA), Ripple (XRP), and Dogecoin (DOGE). This represents a limited selection against the backdrop of the broader crypto market, suggesting a low relative share in the total addressable crypto trading volume. Costs are structured to be competitive, with commissions ranging from 0.12% to 0.18% of trade value, subject to a minimum of just $1.75 per order. On a specific day, April 9, 2025, the company saw a trading volume surge to 7.13 billion, marking a 48.73% increase from the prior day, demonstrating the volatile, high-growth nature of the market.
International Retail Expansion Efforts
The push into specific international retail segments via tailored offerings is a clear investment in capturing market share in high-potential geographies. The launch of the IBKR Lite pricing plan in Singapore in August 2025 is explicitly designed as a customer acquisition vehicle, trading near-term commission revenue for funded account scale. This plan offers zero-commission trading for U.S. stocks and ETFs, with no platform or settlement fees. Simultaneously, the rollout of NISA accounts in Japan during July 2025 targets a vast pool of conservative savers, allowing tax-free investment growth up to ¥1.2 million annually. This move directly challenges domestic giants like SBI Securities and Rakuten Securities in a market where Japanese households hold roughly $11 trillion in low-yield bank deposits. The Q2 2025 results showed commission revenue of $516 million and net revenue of $1.4 billion, providing the financial base for these expansionary investments.
Prediction Market Contracts (Forecast Contracts)
Forecast Contracts represent a foray into a nascent, high-potential regulatory space. These yes-or-no contracts allow trading on economic, political, and climate outcomes nearly 24 hours a day, six days a week. The contracts settle at $1.00 for a correct prediction, with pricing between $0.02 and $0.99. The growth potential is evident: U.S. election-related volume surpassed 1 million contracts by October 2024. Activity continued to accelerate in 2025, with average daily volume (excluding weekends) hitting 23,363 contracts in January, rising to 50,330 in May, and peaking at 399,600 contracts on June 11, 2025. This rapid volume expansion signals high market interest, but the product category itself is new, meaning its long-term market share relative to core brokerage services remains low and unproven.
The IBKR GlobalTrader Mobile Platform
The IBKR GlobalTrader mobile platform is a dedicated push toward the mass-market retail segment, an area where Interactive Brokers Group, Inc. (IBKR) historically holds a lower relative share compared to its professional/active trader base. This platform offers access to over 90+ stock markets worldwide and allows fractional share investment starting with as little as $1. As of September 2025, the firm had 4.127 million client accounts, a 32% year-over-year increase, indicating overall growth that the mobile platform is intended to capture further. Ending client equity stood at $757.5 billion in September 2025. The success of this platform hinges on its ability to convert new, less active users-who are often attracted by low barriers to entry-into sustained revenue generators, which is the classic challenge for a Question Mark.
Here's a snapshot of the quantitative data associated with these growth-focused, lower-share segments as of the latest available 2025 reporting periods.
| Question Mark Segment | Key Metric | Value / Rate | Reporting Period / Date |
|---|---|---|---|
| Cryptocurrency Trading | Number of Available Tokens (Minimum) | 10 (BTC, ETH, LTC, BCH, SOL, ADA, XRP, DOGE, LINK, AVAX, SUI) | April 2025 |
| Cryptocurrency Trading | Commission Range | 0.12% to 0.18% of trade value | April 2025 |
| IBKR Lite Singapore Launch | FY2024 Revenue (Base for Acquisition Strategy) | $9.32B | Fiscal 2024 |
| NISA Accounts Japan Launch | Annual Tax-Free Investment Limit | ¥1.2 million | July 2025 |
| NISA Accounts Japan Launch | Japanese Household Bank Deposits (Context) | Roughly $11 trillion | 2025 |
| Forecast Contracts | Peak Daily Trading Volume (Contracts) | 399,600 contracts | June 11, 2025 |
| Forecast Contracts | Incentive Coupon Rate | 3.37% APY | 2025 |
| IBKR GlobalTrader Push | Total Client Accounts | 4.127 million | September 2025 |
| Overall Growth Context | Client Account Year-over-Year Growth | 32% higher | September 2025 |
These initiatives require significant capital allocation to build out infrastructure, marketing, and regulatory compliance in new jurisdictions or product lines. The success of the Singapore Lite offering, for instance, relies on the firm's ability to monetize the acquired scale through Net Interest Income (NII), margin lending, and securities lending, rather than direct commissions.
The key actions for these Question Marks revolve around rapid market penetration. For the international expansions, the focus is on converting local savers into active users of the global platform. For the newer products like Forecast Contracts, the goal is to establish a dominant position before regulatory uncertainty or competitor entry solidifies the market structure. The low relative share in crypto, despite high growth in trading activity on specific days, suggests the current offering is a toehold, not a market leader.
You're looking at significant cash burn in the near term to support these market entries. If the Singapore Lite acquisition rates slow, or if the regulatory environment for Forecast Contracts tightens, these units could quickly transition into Dogs. The immediate focus for management must be on setting clear, short-term market share milestones for each of these four areas.
- Cryptocurrency trading offers access to 10+ tokens.
- IBKR Lite Singapore offers zero commissions on U.S. stocks/ETFs.
- NISA accounts offer tax-free growth up to ¥1.2 million annually in Japan.
- Forecast Contracts trade nearly 24/6.
- GlobalTrader supports fractional shares starting at $1.
Disclaimer
All information, articles, and product details provided on this website are for general informational and educational purposes only. We do not claim any ownership over, nor do we intend to infringe upon, any trademarks, copyrights, logos, brand names, or other intellectual property mentioned or depicted on this site. Such intellectual property remains the property of its respective owners, and any references here are made solely for identification or informational purposes, without implying any affiliation, endorsement, or partnership.
We make no representations or warranties, express or implied, regarding the accuracy, completeness, or suitability of any content or products presented. Nothing on this website should be construed as legal, tax, investment, financial, medical, or other professional advice. In addition, no part of this site—including articles or product references—constitutes a solicitation, recommendation, endorsement, advertisement, or offer to buy or sell any securities, franchises, or other financial instruments, particularly in jurisdictions where such activity would be unlawful.
All content is of a general nature and may not address the specific circumstances of any individual or entity. It is not a substitute for professional advice or services. Any actions you take based on the information provided here are strictly at your own risk. You accept full responsibility for any decisions or outcomes arising from your use of this website and agree to release us from any liability in connection with your use of, or reliance upon, the content or products found herein.