
|
Installed Building Products, Inc. (IBP) DCF Valuation |
Fully Editable: Tailor To Your Needs In Excel Or Sheets
Professional Design: Trusted, Industry-Standard Templates
Investor-Approved Valuation Models
MAC/PC Compatible, Fully Unlocked
No Expertise Is Needed; Easy To Follow
Installed Building Products, Inc. (IBP) Bundle
Discover the true value of Installed Building Products, Inc. (IBP) with our advanced DCF Calculator! Adjust key assumptions, explore various scenarios, and evaluate how different changes affect Installed Building Products, Inc. (IBP) valuation – all within a single Excel template.
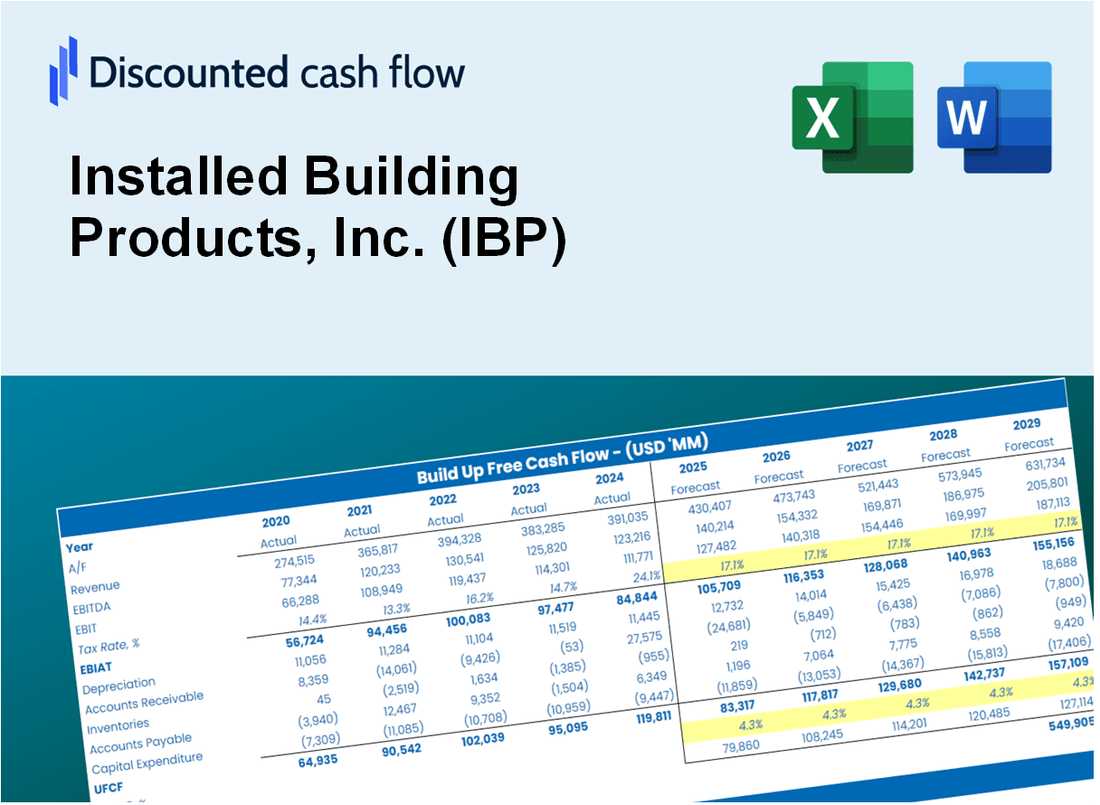
Discounted Cash Flow (DCF) - (USD MM)
| Year | AY1 2020 |
AY2 2021 |
AY3 2022 |
AY4 2023 |
AY5 2024 |
FY1 2025 |
FY2 2026 |
FY3 2027 |
FY4 2028 |
FY5 2029 |
|---|---|---|---|---|---|---|---|---|---|---|
| Revenue | 1,653.2 | 1,968.7 | 2,669.8 | 2,778.6 | 2,941.3 | 3,416.5 | 3,968.5 | 4,609.7 | 5,354.4 | 6,219.5 |
| Revenue Growth, % | 0 | 19.08 | 35.62 | 4.07 | 5.86 | 16.16 | 16.16 | 16.16 | 16.16 | 16.16 |
| EBITDA | 249.5 | 288.0 | 462.6 | 495.8 | 517.8 | 563.7 | 654.8 | 760.5 | 883.4 | 1,026.2 |
| EBITDA, % | 15.09 | 14.63 | 17.33 | 17.84 | 17.6 | 16.5 | 16.5 | 16.5 | 16.5 | 16.5 |
| Depreciation | 88.0 | 102.9 | 117.7 | 125.7 | 134.5 | 164.4 | 190.9 | 221.8 | 257.6 | 299.2 |
| Depreciation, % | 5.32 | 5.23 | 4.41 | 4.52 | 4.57 | 4.81 | 4.81 | 4.81 | 4.81 | 4.81 |
| EBIT | 161.5 | 185.1 | 344.9 | 370.1 | 383.3 | 399.3 | 463.8 | 538.8 | 625.8 | 726.9 |
| EBIT, % | 9.77 | 9.4 | 12.92 | 13.32 | 13.03 | 11.69 | 11.69 | 11.69 | 11.69 | 11.69 |
| Total Cash | 231.5 | 333.5 | 229.6 | 386.5 | 327.6 | 441.4 | 512.7 | 595.5 | 691.7 | 803.5 |
| Total Cash, percent | .0 | .0 | .0 | .0 | .0 | .0 | .0 | .0 | .0 | .0 |
| Account Receivables | 266.6 | 312.8 | 397.2 | 455.0 | 433.9 | 533.1 | 619.2 | 719.3 | 835.5 | 970.4 |
| Account Receivables, % | 16.12 | 15.89 | 14.88 | 16.38 | 14.75 | 15.6 | 15.6 | 15.6 | 15.6 | 15.6 |
| Inventories | 77.2 | 143.0 | 176.6 | 162.8 | 194.6 | 212.0 | 246.2 | 286.0 | 332.2 | 385.9 |
| Inventories, % | 4.67 | 7.27 | 6.61 | 5.86 | 6.62 | 6.2 | 6.2 | 6.2 | 6.2 | 6.2 |
| Accounts Payable | 101.5 | 132.7 | 149.2 | 158.6 | 146.6 | 199.2 | 231.4 | 268.8 | 312.3 | 362.7 |
| Accounts Payable, % | 6.14 | 6.74 | 5.59 | 5.71 | 4.98 | 5.83 | 5.83 | 5.83 | 5.83 | 5.83 |
| Capital Expenditure | -33.6 | -37.0 | -45.6 | -61.6 | -88.6 | -74.1 | -86.1 | -100.0 | -116.2 | -135.0 |
| Capital Expenditure, % | -2.03 | -1.88 | -1.71 | -2.22 | -3.01 | -2.17 | -2.17 | -2.17 | -2.17 | -2.17 |
| Tax Rate, % | 25.92 | 25.92 | 25.92 | 25.92 | 25.92 | 25.92 | 25.92 | 25.92 | 25.92 | 25.92 |
| EBITAT | 119.7 | 141.4 | 254.0 | 270.8 | 283.9 | 296.6 | 344.6 | 400.2 | 464.9 | 540.0 |
| Depreciation | ||||||||||
| Changes in Account Receivables | ||||||||||
| Changes in Inventories | ||||||||||
| Changes in Accounts Payable | ||||||||||
| Capital Expenditure | ||||||||||
| UFCF | -68.2 | 126.5 | 224.6 | 300.3 | 307.1 | 322.9 | 361.2 | 419.5 | 487.3 | 566.1 |
| WACC, % | 11.25 | 11.27 | 11.25 | 11.25 | 11.25 | 11.26 | 11.26 | 11.26 | 11.26 | 11.26 |
| PV UFCF | ||||||||||
| SUM PV UFCF | 1,536.9 | |||||||||
| Long Term Growth Rate, % | 2.00 | |||||||||
| Free cash flow (T + 1) | 577 | |||||||||
| Terminal Value | 6,238 | |||||||||
| Present Terminal Value | 3,660 | |||||||||
| Enterprise Value | 5,197 | |||||||||
| Net Debt | 651 | |||||||||
| Equity Value | 4,546 | |||||||||
| Diluted Shares Outstanding, MM | 28 | |||||||||
| Equity Value Per Share | 161.26 |
What You Will Get
- Editable Excel Template: A fully customizable Excel-based DCF Calculator featuring pre-filled real IBP financials.
- Real-World Data: Historical data and forward-looking estimates (as indicated in the yellow cells).
- Forecast Flexibility: Modify forecast assumptions such as revenue growth, EBITDA %, and WACC.
- Automatic Calculations: Instantly observe the effect of your inputs on Installed Building Products, Inc.'s valuation.
- Professional Tool: Designed for investors, CFOs, consultants, and financial analysts.
- User-Friendly Design: Organized for clarity and ease of use, complete with step-by-step instructions.
Key Features
- Customizable Forecast Inputs: Adjust essential factors such as revenue growth, EBITDA %, and capital expenditures.
- Instant DCF Valuation: Quickly computes intrinsic value, NPV, and additional metrics.
- High-Precision Accuracy: Leverages Installed Building Products, Inc.'s (IBP) actual financial data for credible valuation results.
- Effortless Scenario Analysis: Easily evaluate various assumptions and analyze different outcomes.
- Efficiency Booster: Remove the hassle of creating intricate valuation models from the ground up.
How It Works
- Step 1: Download the Excel file.
- Step 2: Review pre-entered Installed Building Products, Inc. (IBP) data (historical and projected).
- Step 3: Adjust key assumptions (yellow cells) based on your analysis.
- Step 4: View automatic recalculations for Installed Building Products, Inc. (IBP)’s intrinsic value.
- Step 5: Use the outputs for investment decisions or reporting.
Why Choose This Calculator for Installed Building Products, Inc. (IBP)?
- User-Friendly Interface: Tailored for both novices and seasoned professionals.
- Customizable Parameters: Adjust inputs effortlessly to suit your evaluation needs.
- Real-Time Feedback: Observe immediate adjustments to IBP’s valuation as you modify inputs.
- Pre-Configured Data: Comes with IBP’s actual financial metrics for swift assessments.
- Preferred by Industry Experts: Utilized by investors and analysts for making well-informed choices.
Who Should Use This Product?
- Professional Investors: Create comprehensive and dependable valuation models for analyzing portfolios related to Installed Building Products, Inc. (IBP).
- Corporate Finance Teams: Evaluate valuation scenarios to inform and shape internal strategies for growth.
- Consultants and Advisors: Offer clients precise valuation insights for Installed Building Products, Inc. (IBP) stock.
- Students and Educators: Utilize real-world data to enhance learning and practice in financial modeling.
- Construction Industry Enthusiasts: Gain insights into how companies like Installed Building Products, Inc. (IBP) are valued in the market.
What the Template Contains
- Preloaded IBP Data: Historical and projected financial data, including revenue, EBIT, and capital expenditures.
- DCF and WACC Models: Professional-grade sheets for calculating intrinsic value and Weighted Average Cost of Capital.
- Editable Inputs: Yellow-highlighted cells for adjusting revenue growth, tax rates, and discount rates.
- Financial Statements: Comprehensive annual and quarterly financials for deeper analysis.
- Key Ratios: Profitability, leverage, and efficiency ratios to evaluate performance.
- Dashboard and Charts: Visual summaries of valuation outcomes and assumptions.
Disclaimer
All information, articles, and product details provided on this website are for general informational and educational purposes only. We do not claim any ownership over, nor do we intend to infringe upon, any trademarks, copyrights, logos, brand names, or other intellectual property mentioned or depicted on this site. Such intellectual property remains the property of its respective owners, and any references here are made solely for identification or informational purposes, without implying any affiliation, endorsement, or partnership.
We make no representations or warranties, express or implied, regarding the accuracy, completeness, or suitability of any content or products presented. Nothing on this website should be construed as legal, tax, investment, financial, medical, or other professional advice. In addition, no part of this site—including articles or product references—constitutes a solicitation, recommendation, endorsement, advertisement, or offer to buy or sell any securities, franchises, or other financial instruments, particularly in jurisdictions where such activity would be unlawful.
All content is of a general nature and may not address the specific circumstances of any individual or entity. It is not a substitute for professional advice or services. Any actions you take based on the information provided here are strictly at your own risk. You accept full responsibility for any decisions or outcomes arising from your use of this website and agree to release us from any liability in connection with your use of, or reliance upon, the content or products found herein.