
|
Indo Count Industries Limited (ICIL.NS) DCF Valuation |
Fully Editable: Tailor To Your Needs In Excel Or Sheets
Professional Design: Trusted, Industry-Standard Templates
Investor-Approved Valuation Models
MAC/PC Compatible, Fully Unlocked
No Expertise Is Needed; Easy To Follow
Indo Count Industries Limited (ICIL.NS) Bundle
Gain insight into your Indo Count Industries Limited (ICILNS) valuation analysis using our sophisticated DCF Calculator! This Excel template comes preloaded with real (ICILNS) data, enabling you to adjust forecasts and assumptions to accurately determine the intrinsic value of Indo Count Industries Limited.
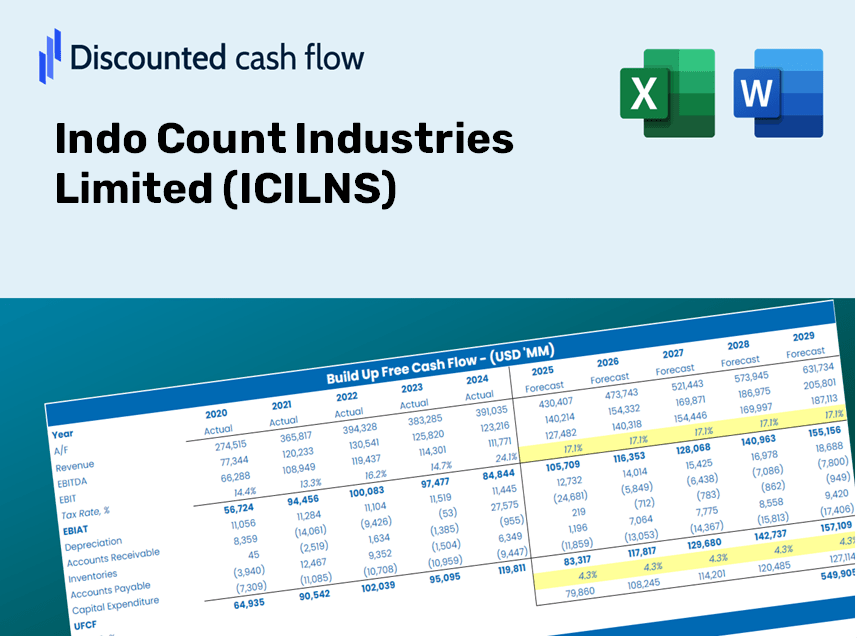
Discounted Cash Flow (DCF) - (USD MM)
| Year | AY1 2021 |
AY2 2022 |
AY3 2023 |
AY4 2024 |
AY5 2025 |
FY1 2026 |
FY2 2027 |
FY3 2028 |
FY4 2029 |
FY5 2030 |
|---|---|---|---|---|---|---|---|---|---|---|
| Revenue | 23,490.5 | 28,420.2 | 27,821.7 | 32,714.5 | 41,513.9 | 48,090.1 | 55,708.1 | 64,532.8 | 74,755.4 | 86,597.4 |
| Revenue Growth, % | 0 | 20.99 | -2.11 | 17.59 | 26.9 | 15.84 | 15.84 | 15.84 | 15.84 | 15.84 |
| EBITDA | 4,022.1 | 5,743.1 | 4,765.5 | 6,027.4 | 5,733.1 | 8,338.2 | 9,659.0 | 11,189.1 | 12,961.6 | 15,014.8 |
| EBITDA, % | 17.12 | 20.21 | 17.13 | 18.42 | 13.81 | 17.34 | 17.34 | 17.34 | 17.34 | 17.34 |
| Depreciation | 431.5 | 409.1 | 647.3 | 825.8 | 1,165.8 | 1,051.8 | 1,218.4 | 1,411.4 | 1,635.0 | 1,894.0 |
| Depreciation, % | 1.84 | 1.44 | 2.33 | 2.52 | 2.81 | 2.19 | 2.19 | 2.19 | 2.19 | 2.19 |
| EBIT | 3,590.6 | 5,334.0 | 4,118.2 | 5,201.6 | 4,567.4 | 7,286.4 | 8,440.6 | 9,777.7 | 11,326.6 | 13,120.8 |
| EBIT, % | 15.29 | 18.77 | 14.8 | 15.9 | 11 | 15.15 | 15.15 | 15.15 | 15.15 | 15.15 |
| Total Cash | 2,903.6 | 4,016.7 | 2,371.5 | 2,279.6 | 2,517.7 | 4,621.6 | 5,353.7 | 6,201.8 | 7,184.2 | 8,322.2 |
| Total Cash, percent | .0 | .0 | .0 | .0 | .0 | .0 | .0 | .0 | .0 | .0 |
| Account Receivables | 5,588.3 | 6,829.1 | 4,785.8 | 4.1 | 6,937.0 | 7,862.0 | 9,107.5 | 10,550.2 | 12,221.4 | 14,157.4 |
| Account Receivables, % | 23.79 | 24.03 | 17.2 | 0.01241039 | 16.71 | 16.35 | 16.35 | 16.35 | 16.35 | 16.35 |
| Inventories | 7,180.4 | 10,746.9 | 8,946.8 | 11,425.2 | 11,625.9 | 15,722.4 | 18,213.0 | 21,098.1 | 24,440.2 | 28,311.8 |
| Inventories, % | 30.57 | 37.81 | 32.16 | 34.92 | 28 | 32.69 | 32.69 | 32.69 | 32.69 | 32.69 |
| Accounts Payable | 2,346.2 | 1,480.3 | 2,129.6 | 3,082.4 | 2,311.5 | 3,639.6 | 4,216.1 | 4,884.0 | 5,657.7 | 6,553.9 |
| Accounts Payable, % | 9.99 | 5.21 | 7.65 | 9.42 | 5.57 | 7.57 | 7.57 | 7.57 | 7.57 | 7.57 |
| Capital Expenditure | -358.4 | -4,515.7 | -3,420.7 | -1,350.7 | -2,515.8 | -3,837.5 | -4,445.4 | -5,149.5 | -5,965.3 | -6,910.2 |
| Capital Expenditure, % | -1.53 | -15.89 | -12.3 | -4.13 | -6.06 | -7.98 | -7.98 | -7.98 | -7.98 | -7.98 |
| Tax Rate, % | 26.25 | 26.25 | 26.25 | 26.25 | 26.25 | 26.25 | 26.25 | 26.25 | 26.25 | 26.25 |
| EBITAT | 2,649.8 | 3,935.5 | 3,178.6 | 3,903.4 | 3,368.3 | 5,443.7 | 6,306.0 | 7,305.0 | 8,462.2 | 9,802.7 |
| Depreciation | ||||||||||
| Changes in Account Receivables | ||||||||||
| Changes in Inventories | ||||||||||
| Changes in Accounts Payable | ||||||||||
| Capital Expenditure | ||||||||||
| UFCF | -7,699.5 | -5,844.4 | 4,897.9 | 6,634.7 | -5,886.2 | -1,035.5 | -80.4 | -93.1 | -107.9 | -124.9 |
| WACC, % | 4.98 | 4.98 | 5.04 | 5.01 | 4.98 | 5 | 5 | 5 | 5 | 5 |
| PV UFCF | ||||||||||
| SUM PV UFCF | -1,326.1 | |||||||||
| Long Term Growth Rate, % | 2.00 | |||||||||
| Free cash flow (T + 1) | -127 | |||||||||
| Terminal Value | -4,247 | |||||||||
| Present Terminal Value | -3,328 | |||||||||
| Enterprise Value | -4,654 | |||||||||
| Net Debt | 13,315 | |||||||||
| Equity Value | -17,969 | |||||||||
| Diluted Shares Outstanding, MM | 198 | |||||||||
| Equity Value Per Share | -90.72 |
Benefits You Will Receive
- Authentic ICILNS Financial Data: Comprehensive historical and projected figures for precise valuation.
- Customizable Parameters: Adjust WACC, tax rates, revenue growth, and capital expenditures as needed.
- Real-Time Calculations: Intrinsic value and NPV are computed automatically.
- Scenario Evaluation: Analyze various scenarios to assess Indo Count Industries Limited’s future outlook.
- User-Friendly Interface: Designed for professionals while remaining approachable for newcomers.
Key Features
- Comprehensive DCF Calculator: Features in-depth unlevered and levered DCF valuation models tailored for Indo Count Industries Limited (ICILNS).
- WACC Calculator: Pre-designed Weighted Average Cost of Capital sheet with adjustable inputs for precise calculations.
- Customizable Forecast Assumptions: Easily modify growth rates, capital expenditures, and discount rates to suit your analysis.
- Integrated Financial Ratios: Evaluate profitability, leverage, and efficiency ratios specifically for Indo Count Industries Limited (ICILNS).
- Visual Dashboard and Charts: Graphical outputs present key valuation metrics for straightforward analysis.
How It Works
- Download: Obtain the comprehensive Excel file featuring Indo Count Industries Limited’s (ICILNS) financial data.
- Customize: Modify forecasts such as revenue growth, EBITDA percentage, and WACC to suit your analysis.
- Update Automatically: Watch as intrinsic value and NPV calculations refresh in real-time.
- Test Scenarios: Generate various projections and instantly compare the results.
- Make Decisions: Leverage the valuation insights to inform your investment strategy.
Why Choose This Calculator for Indo Count Industries Limited (ICILNS)?
- All-in-One Solution: Combines DCF, WACC, and financial ratio analyses for a comprehensive assessment.
- Adjustable Parameters: Modify the yellow-highlighted cells to explore different scenarios.
- In-Depth Analysis: Automatically determines the intrinsic value and Net Present Value for Indo Count Industries Limited (ICILNS).
- Ready-to-Use Data: Comes with historical and projected data for reliable initial calculations.
- High-Quality Standards: Perfect for financial analysts, investors, and business consultants focusing on Indo Count Industries Limited (ICILNS).
Who Can Benefit from Indo Count Industries Limited (ICILNS)?
- Investors: Utilize a top-tier valuation tool to enhance your investment decisions.
- Financial Analysts: Streamline your workflow with a customizable DCF model at your fingertips.
- Consultants: Effortlessly modify the template for impactful client presentations or reports.
- Finance Enthusiasts: Broaden your knowledge of valuation methods through practical, real-world examples.
- Educators and Students: Employ it as a hands-on resource in finance-related academic programs.
Contents of the Template
- Pre-Filled Data: Features Indo Count Industries Limited's historical financials and projections.
- Discounted Cash Flow Model: An editable DCF valuation model with automated calculations.
- Weighted Average Cost of Capital (WACC): A dedicated section for calculating WACC using customized inputs.
- Key Financial Ratios: Assess ICILNS's profitability, efficiency, and financial leverage.
- Customizable Inputs: Easily adjust revenue growth, profit margins, and tax rates.
- Clear Dashboard: Visualizations and tables summarizing the key valuation outcomes.
Disclaimer
All information, articles, and product details provided on this website are for general informational and educational purposes only. We do not claim any ownership over, nor do we intend to infringe upon, any trademarks, copyrights, logos, brand names, or other intellectual property mentioned or depicted on this site. Such intellectual property remains the property of its respective owners, and any references here are made solely for identification or informational purposes, without implying any affiliation, endorsement, or partnership.
We make no representations or warranties, express or implied, regarding the accuracy, completeness, or suitability of any content or products presented. Nothing on this website should be construed as legal, tax, investment, financial, medical, or other professional advice. In addition, no part of this site—including articles or product references—constitutes a solicitation, recommendation, endorsement, advertisement, or offer to buy or sell any securities, franchises, or other financial instruments, particularly in jurisdictions where such activity would be unlawful.
All content is of a general nature and may not address the specific circumstances of any individual or entity. It is not a substitute for professional advice or services. Any actions you take based on the information provided here are strictly at your own risk. You accept full responsibility for any decisions or outcomes arising from your use of this website and agree to release us from any liability in connection with your use of, or reliance upon, the content or products found herein.