
|
IMI plc (IMI.L) DCF Valuation |
Fully Editable: Tailor To Your Needs In Excel Or Sheets
Professional Design: Trusted, Industry-Standard Templates
Investor-Approved Valuation Models
MAC/PC Compatible, Fully Unlocked
No Expertise Is Needed; Easy To Follow
IMI plc (IMI.L) Bundle
Discover the true potential of IMI plc (IMIL) with our advanced DCF Calculator! Adjust key assumptions, explore various scenarios, and examine how alterations affect IMI plc (IMIL) valuation – all within an easy-to-use Excel template.
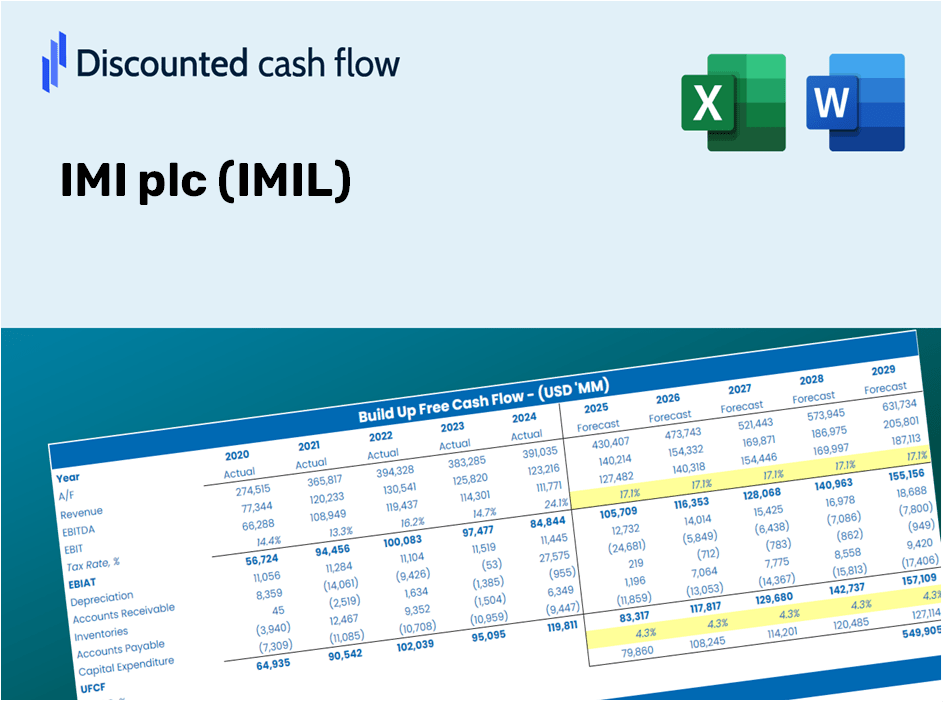
Discounted Cash Flow (DCF) - (USD MM)
| Year | AY1 2021 |
AY2 2022 |
AY3 2023 |
AY4 2024 |
AY5 2025 |
FY1 2026 |
FY2 2027 |
FY3 2028 |
FY4 2029 |
FY5 2030 |
|---|---|---|---|---|---|---|---|---|---|---|
| Revenue | 1,866.0 | 2,049.0 | 2,196.0 | 2,210.0 | 2,304.0 | 2,363.9 | 2,401.4 | 2,424.7 | 2,439.1 | 2,447.9 |
| Revenue Growth, % | 0 | 9.81 | 7.17 | 0.63752 | 4.25 | 2.6 | 1.59 | 0.97013 | 0.59273 | 0.36215 |
| EBITDA | 358.6 | 431.4 | 457.6 | 473.9 | 519.0 | 548.6 | 573.6 | 595.5 | 615.2 | 633.6 |
| EBITDA, % | 19.22 | 21.05 | 20.84 | 21.44 | 22.53 | 23.21 | 23.89 | 24.56 | 25.22 | 25.88 |
| Depreciation | 99.5 | 122.2 | 124.4 | 119.0 | 113.4 | 128.9 | 131.0 | 132.2 | 133.0 | 133.5 |
| Depreciation, % | 5.33 | 5.96 | 5.66 | 5.38 | 4.92 | 5.45 | 5.45 | 5.45 | 5.45 | 5.45 |
| EBIT | 259.1 | 309.2 | 333.2 | 354.9 | 405.6 | 435.5 | 461.8 | 485.8 | 508.0 | 529.1 |
| EBIT, % | 13.89 | 15.09 | 15.17 | 16.06 | 17.6 | 18.42 | 19.23 | 20.03 | 20.83 | 21.61 |
| Total Cash | 97.5 | 135.0 | 108.2 | 150.0 | 114.9 | 134.8 | 137.0 | 138.3 | 139.1 | 139.6 |
| Total Cash, percent | .0 | .0 | .0 | .0 | .0 | .0 | .0 | .0 | .0 | .0 |
| Account Receivables | 428.2 | 462.2 | 402.6 | 514.9 | 576.2 | 602.5 | 623.4 | 640.9 | 656.1 | 669.9 |
| Account Receivables, % | 22.95 | 22.56 | 18.33 | 23.3 | 25.01 | 25.49 | 25.96 | 26.43 | 26.9 | 27.36 |
| Inventories | 335.2 | 416.3 | 437.3 | 447.8 | 396.5 | 452.3 | 459.5 | 463.9 | 466.7 | 468.4 |
| Inventories, % | 17.96 | 20.32 | 19.91 | 20.26 | 17.21 | 19.13 | 19.13 | 19.13 | 19.13 | 19.13 |
| Accounts Payable | 120.3 | 150.4 | 152.0 | 146.2 | 469.3 | 539.8 | 605.7 | 667.7 | 726.4 | 782.2 |
| Accounts Payable, % | 6.45 | 7.34 | 6.92 | 6.62 | 20.37 | 22.83 | 25.22 | 27.54 | 29.78 | 31.95 |
| Capital Expenditure | -57.5 | -71.3 | -79.9 | -91.5 | -98.6 | -88.0 | -89.4 | -90.3 | -90.8 | -91.2 |
| Capital Expenditure, % | -3.08 | -3.48 | -3.64 | -4.14 | -4.28 | -3.72 | -3.72 | -3.72 | -3.72 | -3.72 |
| Tax Rate, % | 25.95 | 25.95 | 25.95 | 25.95 | 25.95 | 25.95 | 25.95 | 25.95 | 25.95 | 25.95 |
| EBITAT | 207.9 | 245.2 | 261.5 | 266.9 | 300.3 | 337.3 | 357.7 | 376.2 | 393.5 | 409.8 |
| Depreciation | ||||||||||
| Changes in Account Receivables | ||||||||||
| Changes in Inventories | ||||||||||
| Changes in Accounts Payable | ||||||||||
| Capital Expenditure | ||||||||||
| UFCF | -393.2 | 211.1 | 346.2 | 165.8 | 628.2 | 366.6 | 437.1 | 458.3 | 476.4 | 492.5 |
| WACC, % | 8.23 | 8.23 | 8.23 | 8.21 | 8.21 | 8.22 | 8.22 | 8.22 | 8.22 | 8.22 |
| PV UFCF | ||||||||||
| SUM PV UFCF | 1,752.5 | |||||||||
| Long Term Growth Rate, % | 2.00 | |||||||||
| Free cash flow (T + 1) | 502 | |||||||||
| Terminal Value | 8,073 | |||||||||
| Present Terminal Value | 5,438 | |||||||||
| Enterprise Value | 7,191 | |||||||||
| Net Debt | 531 | |||||||||
| Equity Value | 6,660 | |||||||||
| Diluted Shares Outstanding, MM | 250 | |||||||||
| Equity Value Per Share | 2,660.63 |
What You Will Receive
- Authentic IMI plc Financials: Features both historical and projected data for precise valuation.
- Customizable Inputs: Adjust WACC, tax rates, revenue growth, and capital expenditures to suit your analysis.
- Automated Calculations: Intrinsic value and NPV are computed in real-time.
- Scenario Analysis: Explore various scenarios to assess IMI plc’s future performance.
- User-Friendly Interface: Designed for experts while remaining accessible to newcomers.
Key Features
- Pre-Loaded Data: Historical financial statements and forecasts for IMI plc (IMIL).
- Fully Customizable Inputs: Adjust WACC, tax rates, revenue growth, and EBITDA margins as needed.
- Real-Time Results: Instantly view the recalculated intrinsic value of IMI plc (IMIL).
- Clear Visual Display: Interactive dashboard charts illustrate valuation outcomes and key performance indicators.
- Designed for Precision: A professional-grade tool for analysts, investors, and finance professionals.
How It Works
- Download: Get the pre-configured Excel file containing IMI plc’s (IMIL) financial data.
- Customize: Modify projections, such as revenue growth, EBITDA %, and WACC.
- Update Automatically: The intrinsic value and NPV calculations refresh in real-time.
- Test Scenarios: Develop various projections and instantly compare results.
- Make Decisions: Utilize the valuation findings to inform your investment strategy.
Why Opt for the IMI plc (IMIL) Calculator?
- Time Efficient: Skip the hassle of developing a DCF model from scratch – it’s immediately available for use.
- Enhanced Accuracy: Dependable financial data and formulas minimize valuation errors.
- Completely Customizable: Adjust the model to suit your specific assumptions and forecasts.
- User-Friendly: Intuitive charts and outputs facilitate easy analysis of results.
- Widely Endorsed: Crafted for professionals who prioritize accuracy and functionality.
Who Should Use This Product?
- Individual Investors: Gain insights to make informed decisions regarding buying or selling IMI plc (IMIL) shares.
- Financial Analysts: Enhance valuation methodologies with accessible and ready-to-use financial models for IMI plc (IMIL).
- Consultants: Provide clients with timely and precise valuation insights related to IMI plc (IMIL).
- Business Owners: Learn how major corporations like IMI plc (IMIL) are valued to inform your own business strategies.
- Finance Students: Acquire practical knowledge of valuation techniques through real-world examples and data focused on IMI plc (IMIL).
What the Template Contains
- Pre-Filled DCF Model: IMI plc’s financial data preloaded for immediate use.
- WACC Calculator: Comprehensive calculations for Weighted Average Cost of Capital.
- Financial Ratios: Assess IMI plc’s profitability, leverage, and efficiency.
- Editable Inputs: Modify assumptions such as growth rates, margins, and CAPEX to suit your scenarios.
- Financial Statements: Annual and quarterly reports to facilitate detailed analysis.
- Interactive Dashboard: Easily visualize essential valuation metrics and outcomes.
Disclaimer
All information, articles, and product details provided on this website are for general informational and educational purposes only. We do not claim any ownership over, nor do we intend to infringe upon, any trademarks, copyrights, logos, brand names, or other intellectual property mentioned or depicted on this site. Such intellectual property remains the property of its respective owners, and any references here are made solely for identification or informational purposes, without implying any affiliation, endorsement, or partnership.
We make no representations or warranties, express or implied, regarding the accuracy, completeness, or suitability of any content or products presented. Nothing on this website should be construed as legal, tax, investment, financial, medical, or other professional advice. In addition, no part of this site—including articles or product references—constitutes a solicitation, recommendation, endorsement, advertisement, or offer to buy or sell any securities, franchises, or other financial instruments, particularly in jurisdictions where such activity would be unlawful.
All content is of a general nature and may not address the specific circumstances of any individual or entity. It is not a substitute for professional advice or services. Any actions you take based on the information provided here are strictly at your own risk. You accept full responsibility for any decisions or outcomes arising from your use of this website and agree to release us from any liability in connection with your use of, or reliance upon, the content or products found herein.