
|
ChipMOS TECHNOLOGIES INC. (IMOS): 5 FORCES Analysis [Nov-2025 Updated] |
Fully Editable: Tailor To Your Needs In Excel Or Sheets
Professional Design: Trusted, Industry-Standard Templates
Investor-Approved Valuation Models
MAC/PC Compatible, Fully Unlocked
No Expertise Is Needed; Easy To Follow
ChipMOS TECHNOLOGIES INC. (IMOS) Bundle
You're looking at the outsourced semiconductor assembly and test (OSAT) space right now, and frankly, it's a grind. As a former head analyst, I see ChipMOS TECHNOLOGIES INC. (IMOS) caught between massive capital demands for advanced packaging and the pricing power of its huge fabless customers. Consider this: their Q3 2025 revenue hit US$201.7 million, but utilization was only at 66%, showing the constant fight for volume against rivals like ASE Group. Still, they have a decent war chest with US$426.0 million in cash as of Q3 2025, which helps buffer the high barriers to entry for newcomers. To really understand where the pressure points are-from suppliers demanding specialized gear to the threat of customers doing the testing themselves-you need a deep dive into Porter's Five Forces for ChipMOS TECHNOLOGIES INC. (IMOS) right now.
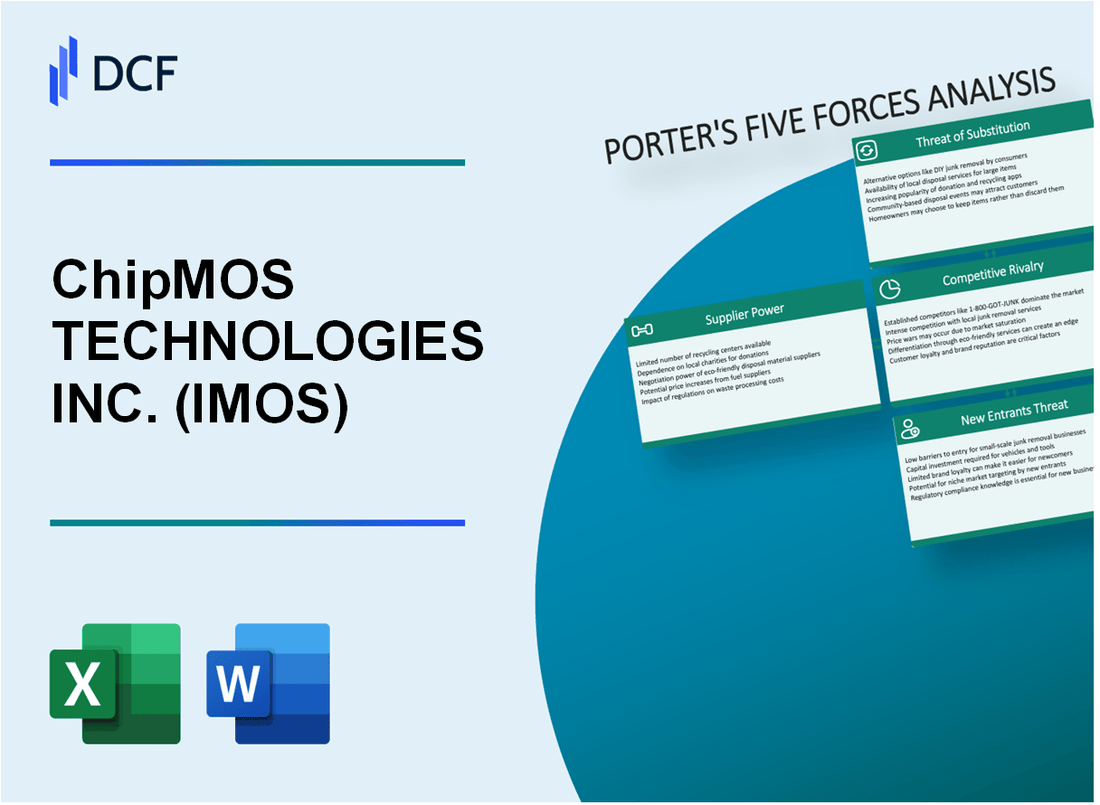
ChipMOS TECHNOLOGIES INC. (IMOS) - Porter's Five Forces: Bargaining power of suppliers
You're looking at ChipMOS TECHNOLOGIES INC.'s supplier landscape, and honestly, it's a tight spot. Suppliers of the specialized gear needed for advanced testing and packaging definitely hold leverage here. Switching out a major piece of capital equipment-say, for a new 3D stacking process-isn't like swapping out office software; it's a massive, multi-million dollar commitment that locks you in for years.
Key materials, like the organic substrates ChipMOS TECHNOLOGIES INC. uses for its package assembly services, come from a supply base that's quite concentrated globally. When a few big players control the supply of a critical component, they can dictate terms, pricing, and lead times. This is especially true as the overall advanced semiconductor packaging market is estimated to be valued at USD 41.61 Bn in 2025, with market concentration noted as High in that segment.
The industry-wide push toward advanced packaging-think 2.5D and 3D IC Packaging, and System in Package (SiP) technologies-means ChipMOS TECHNOLOGIES INC. is increasingly dependent on material vendors who can meet these cutting-edge specifications. This joint development work, often required to qualify a new process node, deepens the relationship and reduces the willingness to switch suppliers over minor cost differences.
Here's a quick look at the scale of the market ChipMOS TECHNOLOGIES INC. operates in, which helps you see why suppliers have pricing power:
| Metric | Value (2025) | Source Context |
|---|---|---|
| Global Semiconductor & IC Packaging Materials Market Revenue | USD 48.48 billion | Indicates the large spend base suppliers are serving |
| Advanced Semiconductor Packaging Market Value | USD 41.61 billion | The segment driving demand for advanced materials |
| ChipMOS TECHNOLOGIES INC. Q3 2025 Revenue | NT$6,143.7 million (approx. US$201.7 million) | Context for ChipMOS's scale relative to the materials market |
| ChipMOS TECHNOLOGIES INC. October 2025 Revenue | US$70.8 million | Recent monthly revenue snapshot |
The need for specialized equipment forces ChipMOS TECHNOLOGIES INC. to make significant capital investments, but their recent approach suggests caution. For instance, in Q1 2025, the company reported a decrease of NT$ 63 million in Capital Expenditures (CapEx) compared to Q1 2024, as they adopted a conservative approach to their 2025 CapEx budget. Still, these necessary, high-cost equipment purchases mean that when a supplier of, say, advanced probing or bumping machinery offers a new platform, ChipMOS TECHNOLOGIES INC. has to weigh the cost of not upgrading against the immediate capital outlay. Major industry players are making big moves; for example, one competitor announced a $260 million upgrade for an advanced packaging material platform in November 2025. That kind of spending sets the bar high for the technology ChipMOS TECHNOLOGIES INC. needs to stay competitive, giving equipment makers leverage.
The bargaining power is further amplified because the specialized nature of the work-like supporting customers' technology roadmaps on a turnkey basis-requires close collaboration with suppliers from the design phase onward. If onboarding takes 14+ days, churn risk rises, so you stick with the known entity.
ChipMOS TECHNOLOGIES INC. (IMOS) - Porter's Five Forces: Bargaining power of customers
When you look at ChipMOS TECHNOLOGIES INC. (IMOS), the power held by its buyers-the large fabless semiconductor companies and integrated device manufacturers (IDMs)-is a major factor shaping pricing and contract terms. These customers are the lifeblood of the outsourced semiconductor assembly and test (OSAT) industry, and their sheer scale gives them significant leverage.
Large fabless and IDM customers possess significant volume leverage for pricing. Honestly, when you are dealing with the biggest names in chip design and manufacturing, they can easily shift significant volumes between OSAT providers to drive down per-unit costs. ChipMOS TECHNOLOGIES INC. serves these leading players, meaning contract negotiations are rarely one-sided. The company's focus on supporting customers and increasing market share, as noted in its Q2 2025 commentary, suggests an awareness of this dynamic; you have to keep them happy to retain the business.
Customers can threaten backward integration, especially for less complex testing services. This is a classic OSAT risk. If a major customer decides that a specific, less-differentiated testing service can be brought in-house more cost-effectively, or if they partner too closely with a competitor who can offer that integration, ChipMOS TECHNOLOGIES INC. faces a real threat of losing that revenue stream. The company's stated need to monitor trade policies to best support customers shows they are actively managing external risks that could affect buyer operations and, consequently, their own order flow.
ChipMOS's Q3 2025 revenue was US$201.7 million, indicating reliance on major contracts. That figure, which translates to NT$6,143.7 million based on the NT$30.46/US$1.00 exchange rate for the quarter ended September 30, 2025, is a clear indicator of dependence on a relatively concentrated customer base. When a significant portion of your revenue comes from a handful of large orders, those customers know their importance to your quarterly performance. For context on the recent performance that underpins these contracts, the net profit attributable to equity holders in that same quarter was US$11.6 million.
Long-term technical partnerships for turnkey solutions reduce the incentive to switch providers. This is where ChipMOS TECHNOLOGIES INC. builds a moat. If the company is deeply embedded in a customer's complex, multi-step process-offering end-to-end assembly and test services-the switching costs become very high. It's not just about finding a cheaper price; it's about re-qualifying processes, which takes time and risks production delays. The company emphasizes building long-term value for shareholders by prioritizing customer support, which is the flip side of securing that long-term commitment.
Here's a quick look at the recent financial context surrounding these customer relationships:
| Metric | Value (Q3 2025) | Value (Q2 2025) |
|---|---|---|
| Revenue (US$) | US$201.7 million | US$188.3 million |
| Revenue (NT$) | NT$6,143.7 million | NT$5,735.8 million |
| Net Profit Attributable to Equity Holders (US$) | US$11.6 million | Net Loss (US$17.5 million) |
| Overall Utilization Rate | 66% | 65% |
The slight uptick in utilization to 66% in Q3 2025, up from 65% in Q2 2025, suggests that customer allocations were stable or slightly improving during that period, but the overall gross margin of 11.09% remains low by historical standards, which buyers can certainly use as a negotiating point.
You should definitely keep an eye on how ChipMOS TECHNOLOGIES INC. manages its service mix. The company's revenue drivers are shifting:
- Memory product revenue increased 16% vs Q2 2025.
- DDIC revenue was down about 22% year-over-year.
- September 2025 revenue saw a 10.5% year-over-year increase.
If a customer segment like DDIC is softening, the leverage held by customers in the growing memory segment definitely increases. Finance: draft a sensitivity analysis on revenue concentration by top 5 customers by next Wednesday.
ChipMOS TECHNOLOGIES INC. (IMOS) - Porter's Five Forces: Competitive rivalry
You're looking at the competitive landscape for ChipMOS TECHNOLOGIES INC., and honestly, the rivalry in the Outsourced Semiconductor Assembly and Test (OSAT) sector is fierce. It's a constant battle for capacity utilization and technological relevance.
High rivalry exists among global OSAT leaders, including major competitor ASE Group. ChipMOS TECHNOLOGIES INC. is one of 13 listed competitors for ASE Group in the space. To put this in perspective, ASE Holdings, the world's second-largest player after Amkor Technology, raised its 2025 capital expenditure to US$5.5B. This level of spending from a direct rival shows you the capital commitment required just to stay in the game.
The industry is capital-intensive, forcing players to chase volume to maintain utilization. For ChipMOS TECHNOLOGIES INC., the overall utilization rate increased to 66% in Q3 2025, up from 65% in Q2 2025. You need that volume to cover the fixed costs associated with all that specialized equipment. Here's a quick look at how ChipMOS TECHNOLOGIES INC.'s utilization stacks up against its recent top-line performance:
| Metric | Value (Q3 2025) | Value (October 2025) |
|---|---|---|
| Revenue (US$ million) | US$201.7 million | US$70.8 million |
| Gross Profit Change (QoQ) | Expanded 101% vs 2Q25 | N/A |
| Overall Utilization Rate | 66% | N/A |
| Cash and Cash Equivalents (9M 2025) | US$426.0 Million | N/A |
Pricing pressure is intense, particularly in commoditized memory and display driver IC testing. Still, ChipMOS TECHNOLOGIES INC. saw its October 2025 revenue increase by 22.0% year-over-year, driven by robust demand for memory products supporting computing and datacenters, along with a favorable product mix. That favorable mix suggests that while commoditized testing is tough, success in higher-value segments provides some pricing leverage.
Competitors constantly invest in advanced technologies like Wafer Level CSP and 3D to gain an edge. For instance, ASE Technology Holding expects its revenue from leading-edge advanced packaging and testing to more than double to $1.6 billion in 2025. This focus on advanced packaging, which is critical for AI chips, forces ChipMOS TECHNOLOGIES INC. to maintain its own aggressive technology roadmap just to keep pace with the leading edge.
The competitive environment demands continuous capital deployment, as seen in these industry-relevant figures:
- Global semiconductor industry sales projected at US$697 billion for 2025.
- Projected industry capital expenditures for 2025 around $185 billion.
- ChipMOS TECHNOLOGIES INC. reported net free cash inflow of NT$1,520.5 Million for the first nine months of 2025.
ChipMOS TECHNOLOGIES INC. (IMOS) - Porter's Five Forces: Threat of substitutes
You're looking at the core of the competitive landscape here; the threat of substitutes for ChipMOS TECHNOLOGIES INC. isn't about a single competitor, but about customers deciding to do the work themselves or choosing a fundamentally different technology path. Honestly, this force is always present in the outsourced semiconductor assembly and test (OSAT) space.
The primary substitute is customer in-house assembly and final test operations. While ChipMOS TECHNOLOGIES INC. operates within a global OSAT market estimated at USD 47.10 billion in 2025, this figure inherently represents the portion of the market that is outsourced, meaning a significant portion of total semiconductor back-end work remains in-house at IDMs (Integrated Device Manufacturers) or large foundries. The fact that the Semiconductor Assembly and Testing Service Market is projected to be USD 40.8 billion in 2025 shows the scale of outsourcing, but the uncaptured portion represents the potential for substitution back in-house, especially for high-volume, standardized processes.
New packaging technologies (e.g., COF/COG alternatives) can displace existing package types. For instance, the global COF (Chip-on-Film) package substrate market is estimated to reach USD 1659 million by 2033, indicating the relevance of these technologies. However, specific 2025 data on the market penetration rate of direct substitutes for ChipMOS TECHNOLOGIES INC.'s specific package types-beyond the general trend toward advanced packaging like SiP-is not readily available to quantify the exact displacement risk right now.
Substitution is lower for high-value, specialized services like gold bumping and advanced mixed-signal test. You can see this clearly in ChipMOS TECHNOLOGIES INC.'s own Q1 2025 revenue mix, which shows specialization commands a significant portion of their business. Here's the quick math on their Q1 2025 revenue breakdown by service type:
| Service/Product Category | Percentage of Q1 2025 Revenue |
|---|---|
| Wafer Bumping | 25.4% |
| Gold Bumping (Product Basis) | 23.9% |
| Mixed-signal and Memory Testing | 21.8% |
| Assembly Services | 24.4% |
The USD 5,500 million global Gold Bump Packaging and Testing market size projected for 2025 further underscores the value of this specialized area, which is harder for a general in-house team to replicate with the same efficiency or quality standards as a dedicated OSAT provider like ChipMOS TECHNOLOGIES INC.
The shift to System-in-Package (SiP) technology requires complex integration, limiting easy substitution. The System-in-Package (SiP) die market is estimated to reach USD 11.09 billion in 2025. Because SiP involves integrating diverse functionalities-processors, memory, sensors-into a single module, it demands advanced, heterogeneous integration capabilities. This complexity acts as a barrier, making it difficult for a customer to easily bring that highly integrated process in-house compared to simpler, discrete testing or assembly tasks.
The utilization rates ChipMOS TECHNOLOGIES INC. achieved in Q1 2025 also suggest where the substitution threat is most acute versus where their specialized value is recognized:
- Assembly Utilization: 55%
- Average Test Utilization: 61%
- DDIC Utilization: 65%
Lower utilization in the more commoditized areas, like assembly at 55%, suggests a higher potential for customers to pull that work back in-house if cost advantages erode, while higher utilization in areas like DDIC (65%) suggests stronger service stickiness.
ChipMOS TECHNOLOGIES INC. (IMOS) - Porter's Five Forces: Threat of new entrants
The threat of new entrants into the Outsourced Semiconductor Assembly and Test (OSAT) industry, where ChipMOS TECHNOLOGIES INC. operates, is generally considered low to moderate due to several structural barriers. These barriers are significant hurdles that a new player must overcome to compete effectively against incumbents like ChipMOS TECHNOLOGIES INC.
High capital expenditure for state-of-the-art facilities creates a significant barrier to entry.
Building out the necessary infrastructure for modern semiconductor packaging and testing requires massive upfront investment. The industry trend shows established players are continually increasing their spending to keep pace with advanced packaging and chip heterogeneous integration technology, which is critical for high-growth areas like AI/ML and High-Performance Computing (HPC). For context on the scale of investment, one OSAT facility build-out planned by a competitor involved a total capital expenditure of approximately INR 33bn. Furthermore, the overall OSAT sector is projected to grow by 8% in 2025, which necessitates continuous, large-scale CapEx just to maintain market share, let alone enter the market.
The requirement for defintely specialized technical know-how and long-term quality certifications is high.
The complexity of advanced packaging techniques, such as those required for AI accelerators, demands deep, specialized engineering expertise that takes years to cultivate. Beyond the technical skill, securing long-term quality certifications from major Integrated Device Manufacturers (IDMs) and fabless companies is a protracted, expensive process. New entrants face a steep learning curve to meet the stringent quality and reliability standards that ChipMOS TECHNOLOGIES INC. and peers have spent decades establishing.
New players struggle to achieve the economies of scale and utilization of established OSATs.
Achieving cost-effective production hinges on high utilization rates, which are difficult for a newcomer to secure without established customer contracts. Established players like ChipMOS TECHNOLOGIES INC. are already operating at significant scale; for instance, ChipMOS TECHNOLOGIES INC.'s utilization rate in Q3 2025 was 66%. A new entrant must secure enough volume to spread fixed costs, a challenge compounded by the fact that major customers often consolidate their business with proven suppliers. For example, some established OSAT capacities are heavily anchored, with the top 4 anchor clients occupying 60% of capacity for one player servicing nearly 10 clients total.
Existing players have strong balance sheets; ChipMOS had US$426.0 million in cash in Q3 2025.
The financial strength of incumbents allows them to weather cyclical downturns and fund necessary CapEx without relying heavily on external, dilutive financing. ChipMOS TECHNOLOGIES INC. demonstrates this stability, reporting cash and cash equivalents of US$426.0 million as of September 30, 2025. This robust liquidity, supported by a US$50 million net free cash inflow over the first nine months of 2025, provides a significant buffer against aggressive pricing from new competitors.
Key Financial Metrics for ChipMOS TECHNOLOGIES INC. (IMOS) as of Q3 2025:
| Metric | Value | Context/Period |
|---|---|---|
| Cash and Cash Equivalents | US$426.0 million | As of September 30, 2025 |
| Q3 2025 Revenue | US$201.7 million | Third Quarter 2025 |
| Utilization Rate | 66% | Third Quarter 2025 |
| Net Free Cash Inflow | NT$1,520.5 million (Approx. US$50 million) | First Nine Months of 2025 |
The barriers to entry can be summarized by the required scale and financial muscle:
- Massive initial CapEx for advanced tooling.
- Need for proven, long-term quality validation.
- Difficulty in immediately matching incumbent utilization rates.
- Strong cash reserves of established firms like ChipMOS TECHNOLOGIES INC.
Disclaimer
All information, articles, and product details provided on this website are for general informational and educational purposes only. We do not claim any ownership over, nor do we intend to infringe upon, any trademarks, copyrights, logos, brand names, or other intellectual property mentioned or depicted on this site. Such intellectual property remains the property of its respective owners, and any references here are made solely for identification or informational purposes, without implying any affiliation, endorsement, or partnership.
We make no representations or warranties, express or implied, regarding the accuracy, completeness, or suitability of any content or products presented. Nothing on this website should be construed as legal, tax, investment, financial, medical, or other professional advice. In addition, no part of this site—including articles or product references—constitutes a solicitation, recommendation, endorsement, advertisement, or offer to buy or sell any securities, franchises, or other financial instruments, particularly in jurisdictions where such activity would be unlawful.
All content is of a general nature and may not address the specific circumstances of any individual or entity. It is not a substitute for professional advice or services. Any actions you take based on the information provided here are strictly at your own risk. You accept full responsibility for any decisions or outcomes arising from your use of this website and agree to release us from any liability in connection with your use of, or reliance upon, the content or products found herein.