
|
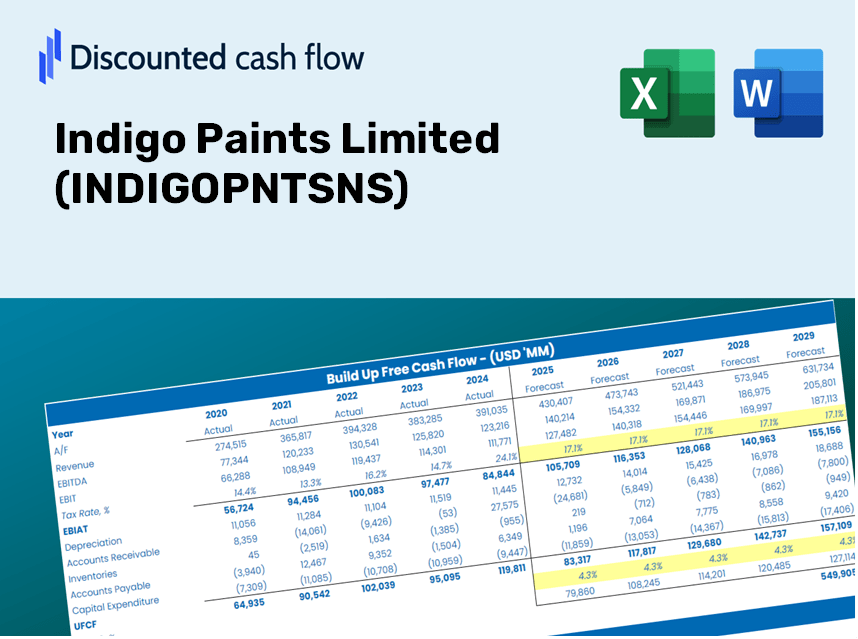
Indigo Paints Limited (INDIGOPNTS.NS) DCF Valuation |
Fully Editable: Tailor To Your Needs In Excel Or Sheets
Professional Design: Trusted, Industry-Standard Templates
Investor-Approved Valuation Models
MAC/PC Compatible, Fully Unlocked
No Expertise Is Needed; Easy To Follow
Indigo Paints Limited (INDIGOPNTS.NS) Bundle
Whether you're an investor or an analyst, this (INDIGOPNTSNS) DCF Calculator is your go-to resource for accurate valuation. With real data from Indigo Paints Limited preloaded, you can adjust forecasts and immediately observe the effects.
Discounted Cash Flow (DCF) - (USD MM)
| Year | AY1 2021 |
AY2 2022 |
AY3 2023 |
AY4 2024 |
AY5 2025 |
FY1 2026 |
FY2 2027 |
FY3 2028 |
FY4 2029 |
FY5 2030 |
|---|---|---|---|---|---|---|---|---|---|---|
| Revenue | 7,199.5 | 9,012.7 | 10,733.3 | 13,003.8 | 13,406.7 | 15,703.6 | 18,393.9 | 21,545.2 | 25,236.3 | 29,559.8 |
| Revenue Growth, % | 0 | 25.18 | 19.09 | 21.15 | 3.1 | 17.13 | 17.13 | 17.13 | 17.13 | 17.13 |
| EBITDA | 1,253.4 | 1,456.5 | 1,902.2 | 2,522.9 | 2,519.8 | 2,810.6 | 3,292.1 | 3,856.1 | 4,516.7 | 5,290.5 |
| EBITDA, % | 17.41 | 16.16 | 17.72 | 19.4 | 18.8 | 17.9 | 17.9 | 17.9 | 17.9 | 17.9 |
| Depreciation | 243.9 | 312.5 | 343.5 | 515.8 | 585.3 | 577.5 | 676.4 | 792.3 | 928.1 | 1,087.0 |
| Depreciation, % | 3.39 | 3.47 | 3.2 | 3.97 | 4.37 | 3.68 | 3.68 | 3.68 | 3.68 | 3.68 |
| EBIT | 1,009.5 | 1,144.0 | 1,558.8 | 2,007.0 | 1,934.5 | 2,233.1 | 2,615.7 | 3,063.8 | 3,588.7 | 4,203.5 |
| EBIT, % | 14.02 | 12.69 | 14.52 | 15.43 | 14.43 | 14.22 | 14.22 | 14.22 | 14.22 | 14.22 |
| Total Cash | 3,079.9 | 1,883.1 | 1,806.6 | 1,996.4 | 2,632.2 | 3,627.2 | 4,248.7 | 4,976.5 | 5,829.1 | 6,827.8 |
| Total Cash, percent | .0 | .0 | .0 | .0 | .0 | .0 | .0 | .0 | .0 | .0 |
| Account Receivables | 1,321.2 | 1,717.5 | 2,001.1 | 2,232.7 | 2,438.6 | 2,870.9 | 3,362.8 | 3,938.9 | 4,613.7 | 5,404.1 |
| Account Receivables, % | 18.35 | 19.06 | 18.64 | 17.17 | 18.19 | 18.28 | 18.28 | 18.28 | 18.28 | 18.28 |
| Inventories | 946.7 | 1,177.2 | 1,176.6 | 1,705.9 | 1,535.8 | 1,939.3 | 2,271.6 | 2,660.7 | 3,116.6 | 3,650.5 |
| Inventories, % | 13.15 | 13.06 | 10.96 | 13.12 | 11.46 | 12.35 | 12.35 | 12.35 | 12.35 | 12.35 |
| Accounts Payable | 1,855.7 | 2,014.1 | 1,991.4 | 2,289.9 | 1,767.1 | 3,061.2 | 3,585.6 | 4,199.9 | 4,919.4 | 5,762.2 |
| Accounts Payable, % | 25.78 | 22.35 | 18.55 | 17.61 | 13.18 | 19.49 | 19.49 | 19.49 | 19.49 | 19.49 |
| Capital Expenditure | -660.5 | -1,207.8 | -1,992.6 | -1,043.6 | -1,362.0 | -1,863.2 | -2,182.4 | -2,556.3 | -2,994.3 | -3,507.2 |
| Capital Expenditure, % | -9.17 | -13.4 | -18.56 | -8.03 | -10.16 | -11.86 | -11.86 | -11.86 | -11.86 | -11.86 |
| Tax Rate, % | 25.37 | 25.37 | 25.37 | 25.37 | 25.37 | 25.37 | 25.37 | 25.37 | 25.37 | 25.37 |
| EBITAT | 730.5 | 841.3 | 1,319.4 | 1,488.9 | 1,443.7 | 1,694.3 | 1,984.5 | 2,324.5 | 2,722.8 | 3,189.2 |
| Depreciation | ||||||||||
| Changes in Account Receivables | ||||||||||
| Changes in Inventories | ||||||||||
| Changes in Accounts Payable | ||||||||||
| Capital Expenditure | ||||||||||
| UFCF | -98.3 | -522.4 | -635.4 | 498.6 | 108.4 | 866.7 | 178.9 | 209.5 | 245.4 | 287.5 |
| WACC, % | 5.21 | 5.21 | 5.21 | 5.21 | 5.21 | 5.21 | 5.21 | 5.21 | 5.21 | 5.21 |
| PV UFCF | ||||||||||
| SUM PV UFCF | 1,588.7 | |||||||||
| Long Term Growth Rate, % | 4.00 | |||||||||
| Free cash flow (T + 1) | 299 | |||||||||
| Terminal Value | 24,736 | |||||||||
| Present Terminal Value | 19,190 | |||||||||
| Enterprise Value | 20,779 | |||||||||
| Net Debt | -98 | |||||||||
| Equity Value | 20,877 | |||||||||
| Diluted Shares Outstanding, MM | 48 | |||||||||
| Equity Value Per Share | 439.10 |
What You Will Receive
- Adaptable Forecast Inputs: Modify key assumptions (growth %, margins, WACC) effortlessly to explore various scenarios.
- Real-World Data: Indigo Paints Limited's financial metrics pre-loaded to kickstart your analysis.
- Automatic DCF Outputs: The template computes Net Present Value (NPV) and intrinsic value automatically.
- Professional and Customizable: A sleek Excel model designed to suit your valuation requirements.
- Designed for Analysts and Investors: Perfect for evaluating projections, confirming strategies, and increasing efficiency.
Key Features
- Authentic Indigo Paints Financials: Gain access to precise pre-loaded historical data and future forecasts.
- Customizable Forecast Assumptions: Modify the yellow-highlighted cells for WACC, growth rates, and profit margins.
- Dynamic Calculations: Automatic adjustments for DCF, Net Present Value (NPV), and cash flow assessments.
- User-Friendly Dashboard: Clear charts and summaries to help visualize your valuation outcomes.
- Designed for All Users: An intuitive layout suitable for investors, CFOs, and consultants alike.
How It Operates
- Download the Template: Gain immediate access to the Excel-based INDIGOPNTSNS DCF Calculator.
- Input Your Assumptions: Modify the yellow-highlighted cells to set your growth rates, WACC, margins, and additional parameters.
- Instant Calculations: The model automatically recalculates the intrinsic value of Indigo Paints Limited.
- Test Scenarios: Experiment with various assumptions to analyze potential changes in valuation.
- Analyze and Decide: Leverage the results to inform your investment choices or financial analyses.
Why Choose Indigo Paints Calculator?
- Precision: Leverages authentic Indigo Paints Limited (INDIGOPNTSNS) financials for reliable data.
- Versatility: Crafted to allow users to experiment with and adjust inputs as needed.
- Efficiency: Eliminate the need to create a financial model from the ground up.
- Expert-Grade: Designed with the detail and usability expected at the CFO level.
- Intuitive: Simple to navigate, catering to users without extensive financial modeling skills.
Who Can Benefit from This Product?
- Investors: Accurately assess the fair value of Indigo Paints Limited (INDIGOPNTSNS) before making investment choices.
- CFOs: Utilize a professional-grade DCF model for comprehensive financial reporting and analysis.
- Consultants: Quickly customize the template for valuation reports tailored to client needs.
- Entrepreneurs: Gain valuable insights into financial modeling practices used by leading companies.
- Educators: Employ it as a resource to illustrate various valuation methodologies in teaching.
Contents of the Template
- Operating and Balance Sheet Data: Pre-filled historical data and forecasts for Indigo Paints Limited (INDIGOPNTSNS), including revenue, EBITDA, EBIT, and capital expenditures.
- WACC Calculation: A dedicated sheet for the Weighted Average Cost of Capital (WACC), featuring parameters such as Beta, risk-free rate, and share price.
- DCF Valuation (Unlevered and Levered): Customizable Discounted Cash Flow models that provide intrinsic value alongside detailed calculations.
- Financial Statements: Pre-loaded annual and quarterly financial statements to aid in analysis.
- Key Ratios: Contains profitability, leverage, and efficiency ratios specific to Indigo Paints Limited (INDIGOPNTSNS).
- Dashboard and Charts: Visual summary of valuation results and assumptions for easy analysis.
Disclaimer
All information, articles, and product details provided on this website are for general informational and educational purposes only. We do not claim any ownership over, nor do we intend to infringe upon, any trademarks, copyrights, logos, brand names, or other intellectual property mentioned or depicted on this site. Such intellectual property remains the property of its respective owners, and any references here are made solely for identification or informational purposes, without implying any affiliation, endorsement, or partnership.
We make no representations or warranties, express or implied, regarding the accuracy, completeness, or suitability of any content or products presented. Nothing on this website should be construed as legal, tax, investment, financial, medical, or other professional advice. In addition, no part of this site—including articles or product references—constitutes a solicitation, recommendation, endorsement, advertisement, or offer to buy or sell any securities, franchises, or other financial instruments, particularly in jurisdictions where such activity would be unlawful.
All content is of a general nature and may not address the specific circumstances of any individual or entity. It is not a substitute for professional advice or services. Any actions you take based on the information provided here are strictly at your own risk. You accept full responsibility for any decisions or outcomes arising from your use of this website and agree to release us from any liability in connection with your use of, or reliance upon, the content or products found herein.