
|
Inovio Pharmaceuticals, Inc. (INO) DCF Valuation |
Fully Editable: Tailor To Your Needs In Excel Or Sheets
Professional Design: Trusted, Industry-Standard Templates
Investor-Approved Valuation Models
MAC/PC Compatible, Fully Unlocked
No Expertise Is Needed; Easy To Follow
Inovio Pharmaceuticals, Inc. (INO) Bundle
Explore the financial outlook of Inovio Pharmaceuticals, Inc. (INO) with our user-friendly DCF Calculator! Enter your projections for growth, margins, and expenses to determine the intrinsic value of Inovio Pharmaceuticals, Inc. (INO) and refine your investment approach.
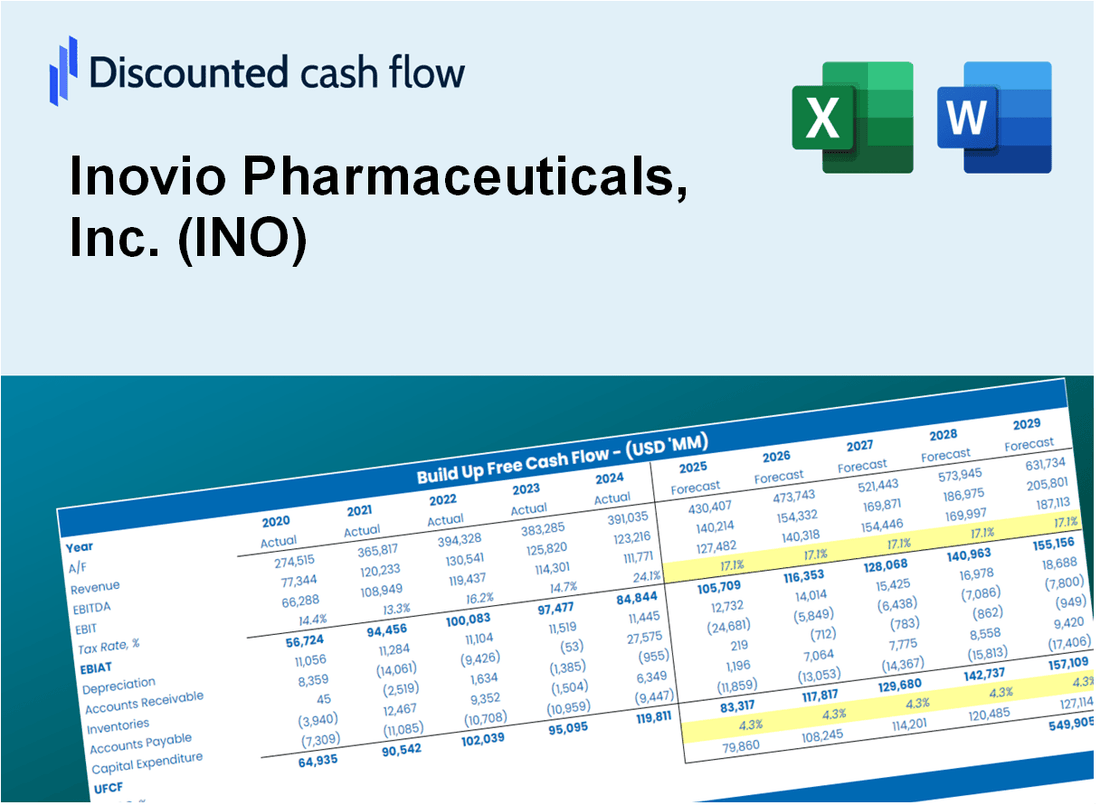
Discounted Cash Flow (DCF) - (USD MM)
| Year | AY1 2020 |
AY2 2021 |
AY3 2022 |
AY4 2023 |
AY5 2024 |
FY1 2025 |
FY2 2026 |
FY3 2027 |
FY4 2028 |
FY5 2029 |
|---|---|---|---|---|---|---|---|---|---|---|
| Revenue | 7.4 | 1.8 | 10.3 | .8 | .2 | .1 | .1 | .1 | .0 | .0 |
| Revenue Growth, % | 0 | -76.05 | 478.23 | -91.89 | -73.83 | -35.44 | -35.44 | -35.44 | -35.44 | -35.44 |
| EBITDA | -149.6 | -296.6 | -270.9 | -130.4 | -103.9 | -.1 | -.1 | -.1 | .0 | .0 |
| EBITDA, % | -2018.02 | -16709.72 | -2639.8 | -15671.81 | -47735.19 | -100 | -100 | -100 | -100 | -100 |
| Depreciation | 4.6 | 4.7 | 5.5 | 3.5 | 3.1 | .1 | .1 | .0 | .0 | .0 |
| Depreciation, % | 62.44 | 266.56 | 53.56 | 421.09 | 1437.41 | 83.2 | 83.2 | 83.2 | 83.2 | 83.2 |
| EBIT | -154.2 | -301.3 | -276.4 | -133.9 | -107.1 | -.1 | -.1 | -.1 | .0 | .0 |
| EBIT, % | -2080.47 | -16976.28 | -2693.35 | -16092.9 | -49172.6 | -100 | -100 | -100 | -100 | -100 |
| Total Cash | 411.6 | 401.3 | 253.0 | 145.3 | 94.1 | .1 | .1 | .1 | .0 | .0 |
| Total Cash, percent | .0 | .0 | .0 | .0 | .0 | .0 | .0 | .0 | .0 | .0 |
| Account Receivables | 19.1 | 8.0 | 11.7 | 2.4 | 1.2 | .1 | .1 | .1 | .0 | .0 |
| Account Receivables, % | 257.23 | 452.57 | 114.38 | 289.09 | 550.64 | 100 | 100 | 100 | 100 | 100 |
| Inventories | .0 | .0 | .0 | .0 | .0 | .0 | .0 | .0 | .0 | .0 |
| Inventories, % | 0 | 0 | 0 | 0 | 0 | 0 | 0 | 0 | 0 | 0 |
| Accounts Payable | 1.5 | 28.0 | 21.1 | 4.6 | 6.4 | .1 | .1 | .0 | .0 | .0 |
| Accounts Payable, % | 19.81 | 1576.15 | 205.44 | 558.69 | 2958.66 | 83.96 | 83.96 | 83.96 | 83.96 | 83.96 |
| Capital Expenditure | -1.5 | -1.2 | -1.0 | -.3 | -.5 | -.1 | .0 | .0 | .0 | .0 |
| Capital Expenditure, % | -20.52 | -69.36 | -9.44 | -38.57 | -224.03 | -47.58 | -47.58 | -47.58 | -47.58 | -47.58 |
| Tax Rate, % | 99.9 | 99.9 | 99.9 | 99.9 | 99.9 | 99.9 | 99.9 | 99.9 | 99.9 | 99.9 |
| EBITAT | -153.2 | -301.7 | -278.6 | -133.9 | -.1 | -.1 | -.1 | .0 | .0 | .0 |
| Depreciation | ||||||||||
| Changes in Account Receivables | ||||||||||
| Changes in Inventories | ||||||||||
| Changes in Accounts Payable | ||||||||||
| Capital Expenditure | ||||||||||
| UFCF | -167.7 | -260.7 | -284.6 | -137.8 | 5.5 | -5.3 | .0 | .0 | .0 | .0 |
| WACC, % | 10.32 | 10.32 | 10.32 | 10.32 | 9.74 | 10.2 | 10.2 | 10.2 | 10.2 | 10.2 |
| PV UFCF | ||||||||||
| SUM PV UFCF | -4.9 | |||||||||
| Long Term Growth Rate, % | 2.00 | |||||||||
| Free cash flow (T + 1) | 0 | |||||||||
| Terminal Value | 0 | |||||||||
| Present Terminal Value | 0 | |||||||||
| Enterprise Value | -5 | |||||||||
| Net Debt | -54 | |||||||||
| Equity Value | 49 | |||||||||
| Diluted Shares Outstanding, MM | 27 | |||||||||
| Equity Value Per Share | 1.80 |
What You Will Get
- Real Inovio Data: Preloaded financials – from revenue to EBIT – based on actual and projected figures for Inovio Pharmaceuticals, Inc. (INO).
- Full Customization: Adjust all critical parameters (yellow cells) like WACC, growth %, and tax rates specific to Inovio.
- Instant Valuation Updates: Automatic recalculations to analyze the impact of changes on Inovio’s fair value.
- Versatile Excel Template: Tailored for quick edits, scenario testing, and detailed projections for Inovio Pharmaceuticals, Inc. (INO).
- Time-Saving and Accurate: Skip building models from scratch while maintaining precision and flexibility for Inovio.
Key Features
- Customizable Research Parameters: Adjust vital inputs such as clinical trial success rates, R&D expenditures, and market penetration.
- Instant Valuation Metrics: Quickly computes intrinsic value, NPV, and other critical financial indicators.
- High-Precision Analytics: Leverages Inovio’s actual financial data for dependable valuation results.
- Effortless Scenario Testing: Evaluate various hypotheses and analyze results with ease.
- Efficiency Booster: Remove the hassle of constructing intricate valuation models from the ground up.
How It Works
- 1. Access the Template: Download and open the Excel file containing Inovio Pharmaceuticals, Inc.'s (INO) financial data.
- 2. Modify Assumptions: Adjust key parameters such as growth projections, WACC, and capital expenditures.
- 3. Analyze Results Quickly: The DCF model automatically computes intrinsic value and NPV in real-time.
- 4. Evaluate Scenarios: Test various forecasts to explore different valuation possibilities.
- 5. Present with Assurance: Deliver expert valuation insights to enhance your decision-making process.
Why Choose the Inovio Calculator?
- Comprehensive Tool: Features DCF, WACC, and financial ratio analyses tailored for Inovio Pharmaceuticals (INO).
- Customizable Inputs: Modify yellow-highlighted cells to explore different financial scenarios.
- Detailed Insights: Automatically computes Inovio’s intrinsic value and Net Present Value.
- Preloaded Data: Includes historical and forecasted data for precise initial assessments.
- Professional Quality: Perfect for financial analysts, investors, and business consultants focusing on Inovio Pharmaceuticals (INO).
Who Should Use This Product?
- Investors: Evaluate Inovio Pharmaceuticals’ valuation before making investment decisions.
- CFOs and Financial Analysts: Enhance valuation methodologies and assess financial projections.
- Startup Founders: Understand how biotechnology firms like Inovio Pharmaceuticals are appraised.
- Consultants: Provide expert valuation analyses and reports for clients in the healthcare sector.
- Students and Educators: Utilize real-time data to learn and teach valuation strategies in the biotech field.
What the Template Contains
- Pre-Filled DCF Model: Inovio Pharmaceuticals’ financial data preloaded for immediate use.
- WACC Calculator: Detailed calculations for Weighted Average Cost of Capital.
- Financial Ratios: Evaluate Inovio Pharmaceuticals’ profitability, leverage, and efficiency.
- Editable Inputs: Change assumptions such as growth, margins, and CAPEX to fit your scenarios.
- Financial Statements: Annual and quarterly reports to support detailed analysis.
- Interactive Dashboard: Easily visualize key valuation metrics and results.
Disclaimer
All information, articles, and product details provided on this website are for general informational and educational purposes only. We do not claim any ownership over, nor do we intend to infringe upon, any trademarks, copyrights, logos, brand names, or other intellectual property mentioned or depicted on this site. Such intellectual property remains the property of its respective owners, and any references here are made solely for identification or informational purposes, without implying any affiliation, endorsement, or partnership.
We make no representations or warranties, express or implied, regarding the accuracy, completeness, or suitability of any content or products presented. Nothing on this website should be construed as legal, tax, investment, financial, medical, or other professional advice. In addition, no part of this site—including articles or product references—constitutes a solicitation, recommendation, endorsement, advertisement, or offer to buy or sell any securities, franchises, or other financial instruments, particularly in jurisdictions where such activity would be unlawful.
All content is of a general nature and may not address the specific circumstances of any individual or entity. It is not a substitute for professional advice or services. Any actions you take based on the information provided here are strictly at your own risk. You accept full responsibility for any decisions or outcomes arising from your use of this website and agree to release us from any liability in connection with your use of, or reliance upon, the content or products found herein.