
|
Inox Wind Limited (INOXWIND.NS) DCF Valuation |
Fully Editable: Tailor To Your Needs In Excel Or Sheets
Professional Design: Trusted, Industry-Standard Templates
Investor-Approved Valuation Models
MAC/PC Compatible, Fully Unlocked
No Expertise Is Needed; Easy To Follow
Inox Wind Limited (INOXWIND.NS) Bundle
Optimize your time and improve precision with our (INOXWINDNS) DCF Calculator! Utilizing real data from Inox Wind Limited and customizable assumptions, this tool empowers you to forecast, analyze, and value Inox Wind like a seasoned investor.
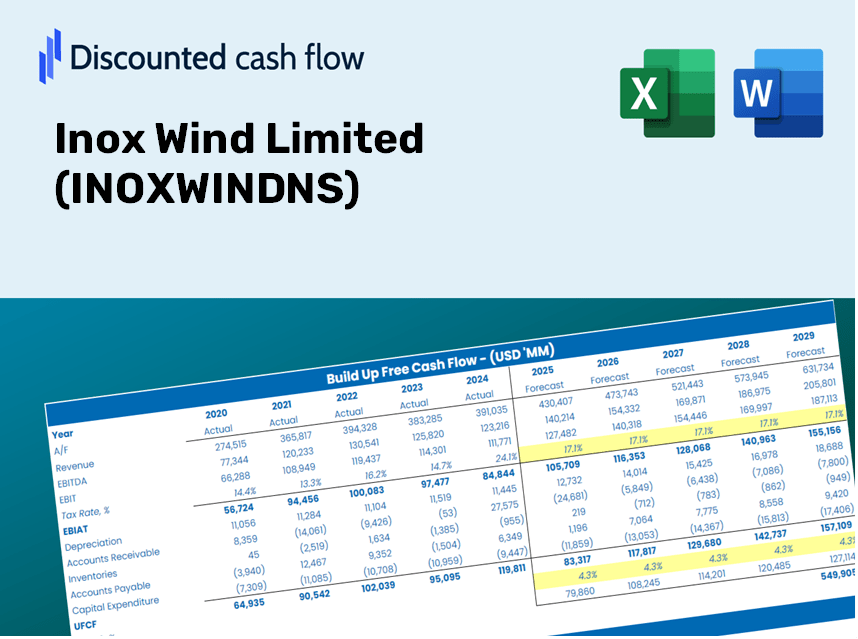
Discounted Cash Flow (DCF) - (USD MM)
| Year | AY1 2021 |
AY2 2022 |
AY3 2023 |
AY4 2024 |
AY5 2025 |
FY1 2026 |
FY2 2027 |
FY3 2028 |
FY4 2029 |
FY5 2030 |
|---|---|---|---|---|---|---|---|---|---|---|
| Revenue | 7,107.3 | 6,246.2 | 7,330.4 | 17,432.3 | 35,571.5 | 53,823.5 | 81,440.8 | 123,228.7 | 186,458.3 | 282,131.4 |
| Revenue Growth, % | 0 | -12.11 | 17.36 | 137.81 | 104.05 | 51.31 | 51.31 | 51.31 | 51.31 | 51.31 |
| EBITDA | -915.4 | -2,849.2 | -3,072.2 | 3,099.2 | 8,881.0 | -6,206.9 | -9,391.7 | -14,210.7 | -21,502.2 | -32,535.2 |
| EBITDA, % | -12.88 | -45.61 | -41.91 | 17.78 | 24.97 | -11.53 | -11.53 | -11.53 | -11.53 | -11.53 |
| Depreciation | 880.3 | 886.7 | 1,061.6 | 1,127.0 | 1,823.1 | 5,668.0 | 8,576.3 | 12,976.9 | 19,635.5 | 29,710.6 |
| Depreciation, % | 12.39 | 14.2 | 14.48 | 6.46 | 5.13 | 10.53 | 10.53 | 10.53 | 10.53 | 10.53 |
| EBIT | -1,795.7 | -3,735.9 | -4,133.8 | 1,972.2 | 7,057.9 | -11,874.9 | -17,968.0 | -27,187.6 | -41,137.7 | -62,245.8 |
| EBIT, % | -25.27 | -59.81 | -56.39 | 11.31 | 19.84 | -22.06 | -22.06 | -22.06 | -22.06 | -22.06 |
| Total Cash | 2,423.6 | 588.1 | 2,709.8 | 2,808.0 | 3,936.8 | 11,589.0 | 17,535.3 | 26,532.9 | 40,147.1 | 60,746.9 |
| Total Cash, percent | .0 | .0 | .0 | .0 | .0 | .0 | .0 | .0 | .0 | .0 |
| Account Receivables | 10,887.8 | 11,082.0 | 9,332.0 | 12,344.9 | 27,293.8 | 48,177.0 | 72,896.9 | 110,300.9 | 166,897.1 | 252,533.4 |
| Account Receivables, % | 153.19 | 177.42 | 127.31 | 70.82 | 76.73 | 89.51 | 89.51 | 89.51 | 89.51 | 89.51 |
| Inventories | 9,168.4 | 10,037.6 | 11,300.8 | 12,447.9 | 13,517.8 | 44,071.6 | 66,685.1 | 100,901.8 | 152,675.2 | 231,014.1 |
| Inventories, % | 129 | 160.7 | 154.16 | 71.41 | 38 | 81.88 | 81.88 | 81.88 | 81.88 | 81.88 |
| Accounts Payable | 10,375.2 | 7,076.7 | 6,168.0 | 6,050.0 | 10,653.8 | 37,547.0 | 56,812.6 | 85,963.6 | 130,072.2 | 196,813.3 |
| Accounts Payable, % | 145.98 | 113.3 | 84.14 | 34.71 | 29.95 | 69.76 | 69.76 | 69.76 | 69.76 | 69.76 |
| Capital Expenditure | -1,203.9 | -1,794.6 | -3,879.3 | -5,381.4 | -6,204.9 | -15,813.7 | -23,927.9 | -36,205.5 | -54,782.8 | -82,892.2 |
| Capital Expenditure, % | -16.94 | -28.73 | -52.92 | -30.87 | -17.44 | -29.38 | -29.38 | -29.38 | -29.38 | -29.38 |
| Tax Rate, % | 16.5 | 16.5 | 16.5 | 16.5 | 16.5 | 16.5 | 16.5 | 16.5 | 16.5 | 16.5 |
| EBITAT | -1,195.2 | -2,747.2 | -4,123.6 | 1,689.7 | 5,893.0 | -9,714.0 | -14,698.4 | -22,240.2 | -33,651.8 | -50,918.9 |
| Depreciation | ||||||||||
| Changes in Account Receivables | ||||||||||
| Changes in Inventories | ||||||||||
| Changes in Accounts Payable | ||||||||||
| Capital Expenditure | ||||||||||
| UFCF | -11,199.8 | -8,017.0 | -7,363.3 | -6,842.7 | -9,903.7 | -44,403.5 | -58,117.7 | -87,938.4 | -133,060.2 | -201,334.5 |
| WACC, % | 4.75 | 4.81 | 5.02 | 4.91 | 4.89 | 4.87 | 4.87 | 4.87 | 4.87 | 4.87 |
| PV UFCF | ||||||||||
| SUM PV UFCF | -440,121.1 | |||||||||
| Long Term Growth Rate, % | 2.00 | |||||||||
| Free cash flow (T + 1) | -205,361 | |||||||||
| Terminal Value | -7,146,243 | |||||||||
| Present Terminal Value | -5,633,067 | |||||||||
| Enterprise Value | -6,073,188 | |||||||||
| Net Debt | 12,871 | |||||||||
| Equity Value | -6,086,059 | |||||||||
| Diluted Shares Outstanding, MM | 1,311 | |||||||||
| Equity Value Per Share | -4,643.46 |
Benefits You Will Receive
- Comprehensive INOXWIND Financials: Access to both historical and projected data for precise valuation.
- Customizable Inputs: Adjust WACC, tax rates, revenue growth, and capital expenditures as needed.
- Dynamic Calculations: Intrinsic value and NPV are computed automatically.
- Scenario Planning: Evaluate various scenarios to assess INOX Wind's future potential.
- User-Friendly Interface: Designed for professionals while remaining easy to use for newcomers.
Key Features
- 🔍 Real-Life INOXWIND Financials: Pre-filled historical and projected data for Inox Wind Limited.
- ✏️ Fully Customizable Inputs: Modify all essential parameters (yellow cells) such as WACC, growth %, and tax rates.
- 📊 Professional DCF Valuation: Integrated formulas compute Inox Wind's intrinsic value utilizing the Discounted Cash Flow method.
- ⚡ Instant Results: Immediately visualize Inox Wind's valuation after making adjustments.
- Scenario Analysis: Evaluate and compare outcomes for different financial assumptions side-by-side.
How It Functions
- Step 1: Download the prebuilt Excel template featuring Inox Wind Limited’s data.
- Step 2: Navigate through the pre-filled sheets to familiarize yourself with the essential metrics.
- Step 3: Modify forecasts and assumptions in the editable yellow cells (WACC, growth, margins).
- Step 4: Instantly see the recalculated results, including Inox Wind Limited’s intrinsic value.
- Step 5: Use the outputs to make informed investment decisions or create reports.
Why Select INOX Wind Limited's Calculator?
- Time Efficient: Skip the hassle of building a DCF model from scratch – it’s ready for immediate use.
- Enhanced Accuracy: Dependable financial data and formulas minimize valuation errors.
- Completely Customizable: Adjust the model to align with your specific assumptions and forecasts.
- User-Friendly: Intuitive charts and outputs simplify result analysis.
- Endorsed by Professionals: Crafted for experts who prioritize precision and ease of use.
Who Can Benefit from This Product?
- Institutional Investors: Develop comprehensive and accurate valuation models for effective portfolio management.
- Corporate Finance Departments: Evaluate valuation scenarios to inform strategic planning within the organization.
- Financial Consultants and Advisors: Equip clients with precise valuation analysis for Inox Wind Limited (INOXWINDNS) stock.
- Students and Instructors: Utilize real-market data to enhance financial modeling skills and education.
- Renewable Energy Enthusiasts: Gain insights into how companies like Inox Wind Limited (INOXWINDNS) are valued in the renewable energy sector.
Contents of the Template
- Pre-Filled Data: Features Inox Wind Limited’s historical financial performance and forecasts.
- Discounted Cash Flow Model: A customizable DCF valuation model with automated calculations.
- Weighted Average Cost of Capital (WACC): A dedicated worksheet for WACC calculations based on user-defined inputs.
- Key Financial Ratios: Assess Inox Wind Limited's profitability, operational efficiency, and debt levels.
- Customizable Inputs: Adjust revenue growth rates, profit margins, and tax percentages effortlessly.
- Clear Dashboard: Visual representations and tables summarizing essential valuation outcomes.
Disclaimer
All information, articles, and product details provided on this website are for general informational and educational purposes only. We do not claim any ownership over, nor do we intend to infringe upon, any trademarks, copyrights, logos, brand names, or other intellectual property mentioned or depicted on this site. Such intellectual property remains the property of its respective owners, and any references here are made solely for identification or informational purposes, without implying any affiliation, endorsement, or partnership.
We make no representations or warranties, express or implied, regarding the accuracy, completeness, or suitability of any content or products presented. Nothing on this website should be construed as legal, tax, investment, financial, medical, or other professional advice. In addition, no part of this site—including articles or product references—constitutes a solicitation, recommendation, endorsement, advertisement, or offer to buy or sell any securities, franchises, or other financial instruments, particularly in jurisdictions where such activity would be unlawful.
All content is of a general nature and may not address the specific circumstances of any individual or entity. It is not a substitute for professional advice or services. Any actions you take based on the information provided here are strictly at your own risk. You accept full responsibility for any decisions or outcomes arising from your use of this website and agree to release us from any liability in connection with your use of, or reliance upon, the content or products found herein.