
|
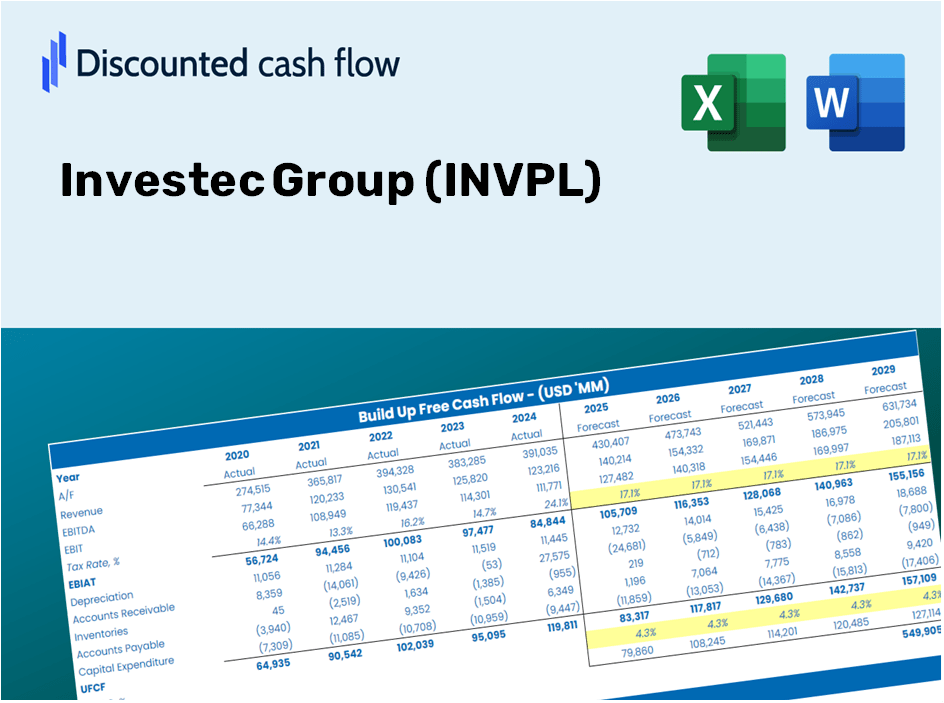
Investec Group (INVP.L) DCF Valuation |
Fully Editable: Tailor To Your Needs In Excel Or Sheets
Professional Design: Trusted, Industry-Standard Templates
Investor-Approved Valuation Models
MAC/PC Compatible, Fully Unlocked
No Expertise Is Needed; Easy To Follow
Investec Group (INVP.L) Bundle
Looking to assess the intrinsic value of Investec Group? Our (INVPL) DCF Calculator integrates real-world data with comprehensive customization features, enabling you to refine forecasts and enhance your investment strategies.
Discounted Cash Flow (DCF) - (USD MM)
| Year | AY1 2021 |
AY2 2022 |
AY3 2023 |
AY4 2024 |
AY5 2025 |
FY1 2026 |
FY2 2027 |
FY3 2028 |
FY4 2029 |
FY5 2030 |
|---|---|---|---|---|---|---|---|---|---|---|
| Revenue | 2,742.8 | 2,916.7 | 2,251.3 | 1,911.3 | 1,995.4 | 1,859.9 | 1,733.5 | 1,615.8 | 1,506.0 | 1,403.7 |
| Revenue Growth, % | 0 | 6.34 | -22.82 | -15.1 | 4.4 | -6.79 | -6.79 | -6.79 | -6.79 | -6.79 |
| EBITDA | 361.6 | 690.6 | 900.8 | 804.3 | .0 | 442.5 | 412.4 | 384.4 | 358.3 | 334.0 |
| EBITDA, % | 13.18 | 23.68 | 40.01 | 42.08 | 0 | 23.79 | 23.79 | 23.79 | 23.79 | 23.79 |
| Depreciation | 24.6 | 72.9 | 37.0 | 50.4 | .0 | 28.6 | 26.6 | 24.8 | 23.1 | 21.6 |
| Depreciation, % | 0.89525 | 2.5 | 1.64 | 2.64 | 0 | 1.54 | 1.54 | 1.54 | 1.54 | 1.54 |
| EBIT | 337.1 | 617.7 | 863.8 | 753.9 | .0 | 413.9 | 385.8 | 359.6 | 335.2 | 312.4 |
| EBIT, % | 12.29 | 21.18 | 38.37 | 39.44 | 0 | 22.26 | 22.26 | 22.26 | 22.26 | 22.26 |
| Total Cash | 6,515.4 | 9,128.6 | 8,466.4 | 7,703.2 | 5,523.1 | 1,859.9 | 1,733.5 | 1,615.8 | 1,506.0 | 1,403.7 |
| Total Cash, percent | .0 | .0 | .0 | .0 | .0 | .0 | .0 | .0 | .0 | .0 |
| Account Receivables | .0 | .0 | .0 | .0 | 784.1 | 146.2 | 136.2 | 127.0 | 118.4 | 110.3 |
| Account Receivables, % | 0 | 0 | 0 | 0 | 39.29 | 7.86 | 7.86 | 7.86 | 7.86 | 7.86 |
| Inventories | .0 | .0 | .0 | .0 | .0 | .0 | .0 | .0 | .0 | .0 |
| Inventories, % | 0 | 0 | 0 | 0 | 0 | 0 | 0 | 0 | 0 | 0 |
| Accounts Payable | 797.8 | 1,128.0 | .0 | .0 | .0 | 252.1 | 234.9 | 219.0 | 204.1 | 190.2 |
| Accounts Payable, % | 29.09 | 38.67 | 0 | 0 | 0 | 13.55 | 13.55 | 13.55 | 13.55 | 13.55 |
| Capital Expenditure | -13.3 | -9.3 | -30.3 | -19.0 | -17.0 | -14.9 | -13.9 | -12.9 | -12.0 | -11.2 |
| Capital Expenditure, % | -0.48629 | -0.31964 | -1.35 | -0.99319 | -0.85164 | -0.79966 | -0.79966 | -0.79966 | -0.79966 | -0.79966 |
| Tax Rate, % | 19.66 | 19.66 | 19.66 | 19.66 | 19.66 | 19.66 | 19.66 | 19.66 | 19.66 | 19.66 |
| EBITAT | 272.8 | 457.3 | 709.5 | 862.6 | .0 | 345.6 | 322.1 | 300.2 | 279.8 | 260.8 |
| Depreciation | ||||||||||
| Changes in Account Receivables | ||||||||||
| Changes in Inventories | ||||||||||
| Changes in Accounts Payable | ||||||||||
| Capital Expenditure | ||||||||||
| UFCF | 1,081.9 | 851.1 | -411.8 | 894.0 | -801.1 | 1,249.3 | 327.7 | 305.4 | 284.7 | 265.3 |
| WACC, % | 5.14 | 5.04 | 5.15 | 5.39 | 5.13 | 5.17 | 5.17 | 5.17 | 5.17 | 5.17 |
| PV UFCF | ||||||||||
| SUM PV UFCF | 2,185.5 | |||||||||
| Long Term Growth Rate, % | 2.00 | |||||||||
| Free cash flow (T + 1) | 271 | |||||||||
| Terminal Value | 8,536 | |||||||||
| Present Terminal Value | 6,634 | |||||||||
| Enterprise Value | 8,820 | |||||||||
| Net Debt | -2,721 | |||||||||
| Equity Value | 11,541 | |||||||||
| Diluted Shares Outstanding, MM | 886 | |||||||||
| Equity Value Per Share | 1,302.43 |
Benefits of Choosing Investec Group (INVPL)
- Adjustable Forecast Variables: Effortlessly modify key assumptions (growth %, profit margins, WACC) to evaluate various scenarios.
- Comprehensive Data Insights: Pre-filled financial data from Investec Group to facilitate your analytical process.
- Automated DCF Calculations: The template computes Net Present Value (NPV) and intrinsic value automatically for your convenience.
- Tailored and Professional Design: A refined Excel model that can be customized to meet your valuation requirements.
- Designed for Analysts and Investors: Perfect for exploring projections, confirming strategies, and optimizing your time.
Key Features
- Comprehensive DCF Calculator: Offers detailed unlevered and levered DCF valuation models tailored for Investec Group (INVPL).
- WACC Calculator: Features a pre-configured Weighted Average Cost of Capital sheet with adjustable inputs.
- Customizable Forecast Assumptions: Adjust growth rates, capital expenditures, and discount rates as needed.
- Integrated Financial Ratios: Evaluate profitability, leverage, and efficiency ratios specific to Investec Group (INVPL).
- Interactive Dashboard and Charts: Visual outputs present key valuation metrics for straightforward analysis.
How It Works
- Step 1: Download the prebuilt Excel template featuring Investec Group (INVPL) data.
- Step 2: Navigate through the pre-filled sheets to familiarize yourself with essential metrics.
- Step 3: Update forecasts and assumptions in the editable yellow cells (WACC, growth, margins).
- Step 4: Instantly view recalibrated results, including the intrinsic value of Investec Group (INVPL).
- Step 5: Make well-informed investment decisions or create reports based on the outputs.
Why Choose the Investec Group (INVPL) Calculator?
- Precise Information: Utilize accurate Investec financial data for trustworthy valuation outcomes.
- Tailored Features: Modify essential metrics such as growth rates, WACC, and tax rates to align with your forecasts.
- Efficiency: Built-in calculations save you the effort of starting from the ground up.
- Professional-Quality Resource: Crafted for investors, analysts, and advisors in the field.
- Easy to Use: A user-friendly design and clear, step-by-step guidance make it accessible for everyone.
Who Can Benefit from Investec Group (INVPL)?
- Investors: Assess the valuation of Investec Group (INVPL) prior to making stock transactions.
- CFOs and Financial Analysts: Optimize valuation workflows and evaluate financial forecasts.
- Startup Founders: Gain insights into how established companies like Investec Group (INVPL) are appraised.
- Consultants: Create comprehensive valuation reports for your clientele.
- Students and Educators: Utilize actual data to practice and impart valuation methodologies.
Contents of the Template
- Pre-Filled Data: Contains Investec Group's historical financial performance and projections.
- Discounted Cash Flow Model: An interactive DCF valuation model with automated calculations.
- Weighted Average Cost of Capital (WACC): A specific sheet designed for WACC calculations using customized inputs.
- Key Financial Ratios: Evaluate Investec Group’s profitability, operational efficiency, and financial leverage.
- Customizable Inputs: Easily modify revenue growth rates, margins, and tax assumptions.
- Comprehensive Dashboard: Visuals and tables that summarize critical valuation metrics.
Disclaimer
All information, articles, and product details provided on this website are for general informational and educational purposes only. We do not claim any ownership over, nor do we intend to infringe upon, any trademarks, copyrights, logos, brand names, or other intellectual property mentioned or depicted on this site. Such intellectual property remains the property of its respective owners, and any references here are made solely for identification or informational purposes, without implying any affiliation, endorsement, or partnership.
We make no representations or warranties, express or implied, regarding the accuracy, completeness, or suitability of any content or products presented. Nothing on this website should be construed as legal, tax, investment, financial, medical, or other professional advice. In addition, no part of this site—including articles or product references—constitutes a solicitation, recommendation, endorsement, advertisement, or offer to buy or sell any securities, franchises, or other financial instruments, particularly in jurisdictions where such activity would be unlawful.
All content is of a general nature and may not address the specific circumstances of any individual or entity. It is not a substitute for professional advice or services. Any actions you take based on the information provided here are strictly at your own risk. You accept full responsibility for any decisions or outcomes arising from your use of this website and agree to release us from any liability in connection with your use of, or reliance upon, the content or products found herein.