
|
Indian Oil Corporation Limited (IOC.NS) DCF Valuation |
Fully Editable: Tailor To Your Needs In Excel Or Sheets
Professional Design: Trusted, Industry-Standard Templates
Investor-Approved Valuation Models
MAC/PC Compatible, Fully Unlocked
No Expertise Is Needed; Easy To Follow
Indian Oil Corporation Limited (IOC.NS) Bundle
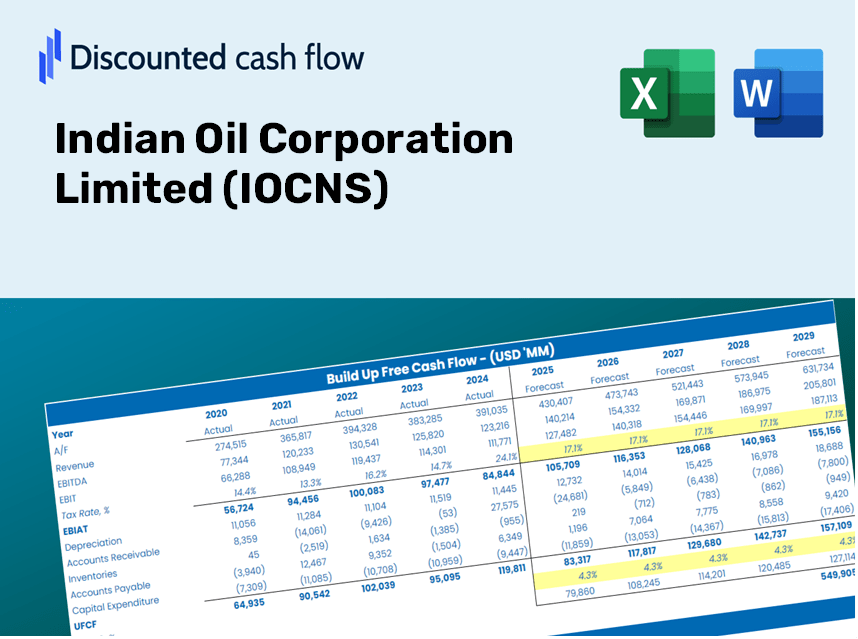
As an investor or analyst, this (IOCNS) DCF Calculator is your go-to resource for accurate valuation. With real data from Indian Oil Corporation Limited already integrated, you can adjust forecasts and witness the effects immediately.
Discounted Cash Flow (DCF) - (USD MM)
| Year | AY1 2021 |
AY2 2022 |
AY3 2023 |
AY4 2024 |
AY5 2025 |
FY1 2026 |
FY2 2027 |
FY3 2028 |
FY4 2029 |
FY5 2030 |
|---|---|---|---|---|---|---|---|---|---|---|
| Revenue | 3,639,496.7 | 5,893,212.0 | 8,417,559.1 | 7,763,518.5 | 7,581,058.1 | 9,374,707.3 | 11,592,726.9 | 14,335,521.4 | 17,727,250.6 | 21,921,449.9 |
| Revenue Growth, % | 0 | 61.92 | 42.83 | -7.77 | -2.35 | 23.66 | 23.66 | 23.66 | 23.66 | 23.66 |
| EBITDA | 394,271.0 | 475,773.1 | 380,981.3 | 767,680.8 | 382,603.8 | 719,368.9 | 889,568.8 | 1,100,037.3 | 1,360,301.9 | 1,682,144.1 |
| EBITDA, % | 10.83 | 8.07 | 4.53 | 9.89 | 5.05 | 7.67 | 7.67 | 7.67 | 7.67 | 7.67 |
| Depreciation | 96,496.8 | 105,357.9 | 130,518.5 | 157,984.1 | 165,917.2 | 191,492.3 | 236,798.7 | 292,824.3 | 362,105.4 | 447,778.2 |
| Depreciation, % | 2.65 | 1.79 | 1.55 | 2.03 | 2.19 | 2.04 | 2.04 | 2.04 | 2.04 | 2.04 |
| EBIT | 297,774.2 | 370,415.2 | 250,462.8 | 609,696.7 | 216,686.6 | 527,876.6 | 652,770.1 | 807,213.0 | 998,196.5 | 1,234,365.9 |
| EBIT, % | 8.18 | 6.29 | 2.98 | 7.85 | 2.86 | 5.63 | 5.63 | 5.63 | 5.63 | 5.63 |
| Total Cash | 110,021.6 | 100,147.9 | 151,939.7 | 135,386.5 | 135,998.0 | 188,716.6 | 233,366.2 | 288,579.7 | 356,856.6 | 441,287.5 |
| Total Cash, percent | .0 | .0 | .0 | .0 | .0 | .0 | .0 | .0 | .0 | .0 |
| Account Receivables | 198,702.4 | 206,712.3 | 227,566.7 | 210,185.5 | 191,797.2 | 317,015.5 | 392,020.2 | 484,770.7 | 599,465.5 | 741,296.8 |
| Account Receivables, % | 5.46 | 3.51 | 2.7 | 2.71 | 2.53 | 3.38 | 3.38 | 3.38 | 3.38 | 3.38 |
| Inventories | 834,274.6 | 1,117,365.1 | 1,211,075.8 | 1,213,758.3 | 1,138,784.9 | 1,629,813.1 | 2,015,420.6 | 2,492,261.3 | 3,081,920.7 | 3,811,091.3 |
| Inventories, % | 22.92 | 18.96 | 14.39 | 15.63 | 15.02 | 17.39 | 17.39 | 17.39 | 17.39 | 17.39 |
| Accounts Payable | 369,640.7 | 490,618.5 | 547,341.3 | 594,541.0 | 605,349.4 | 761,733.5 | 941,956.7 | 1,164,820.0 | 1,440,411.9 | 1,781,207.8 |
| Accounts Payable, % | 10.16 | 8.33 | 6.5 | 7.66 | 7.99 | 8.13 | 8.13 | 8.13 | 8.13 | 8.13 |
| Capital Expenditure | -238,331.8 | -230,371.1 | -326,001.2 | -371,753.5 | -348,499.4 | -444,659.0 | -549,863.6 | -679,959.2 | -840,835.0 | -1,039,773.3 |
| Capital Expenditure, % | -6.55 | -3.91 | -3.87 | -4.79 | -4.6 | -4.74 | -4.74 | -4.74 | -4.74 | -4.74 |
| Tax Rate, % | 20.31 | 20.31 | 20.31 | 20.31 | 20.31 | 20.31 | 20.31 | 20.31 | 20.31 | 20.31 |
| EBITAT | 209,533.3 | 271,175.9 | 163,094.3 | 444,116.5 | 172,677.3 | 381,363.8 | 471,593.0 | 583,170.0 | 721,145.8 | 891,766.1 |
| Depreciation | ||||||||||
| Changes in Account Receivables | ||||||||||
| Changes in Inventories | ||||||||||
| Changes in Accounts Payable | ||||||||||
| Capital Expenditure | ||||||||||
| UFCF | -595,638.0 | -23,959.9 | -90,230.7 | 292,245.5 | 94,265.2 | -331,665.4 | -121,861.0 | -150,692.8 | -186,346.1 | -230,434.9 |
| WACC, % | 6.09 | 6.15 | 5.98 | 6.14 | 6.29 | 6.13 | 6.13 | 6.13 | 6.13 | 6.13 |
| PV UFCF | ||||||||||
| SUM PV UFCF | -864,754.8 | |||||||||
| Long Term Growth Rate, % | 3.50 | |||||||||
| Free cash flow (T + 1) | -238,500 | |||||||||
| Terminal Value | -9,064,040 | |||||||||
| Present Terminal Value | -6,731,391 | |||||||||
| Enterprise Value | -7,596,146 | |||||||||
| Net Debt | 1,515,974 | |||||||||
| Equity Value | -9,112,120 | |||||||||
| Diluted Shares Outstanding, MM | 13,777 | |||||||||
| Equity Value Per Share | -661.40 |
What You Will Receive
- Genuine IOC Data: Preloaded financial metrics – encompassing revenue, EBIT, and more – derived from actual and forecasted figures.
- Comprehensive Customization: Modify all essential parameters (yellow cells) such as WACC, growth %, and tax rates.
- Immediate Valuation Adjustments: Automatic recalculations to assess the effects of changes on IOC’s fair value.
- Flexible Excel Template: Designed for easy edits, scenario analysis, and in-depth projections.
- Efficient and Precise: Avoid starting from scratch while ensuring accuracy and adaptability.
Key Features of Indian Oil Corporation Limited (IOCNS)
- Comprehensive Financial Data: Gain access to precise historical figures and future forecasts.
- Adjustable Forecast Parameters: Modify highlighted cells for metrics like WACC, growth rates, and profit margins.
- Real-Time Calculations: Enjoy automatic updates for DCF, Net Present Value (NPV), and cash flow assessments.
- User-Friendly Dashboard: Visualize your valuation results with clear charts and summaries.
- Designed for All Users: An intuitive layout tailored for investors, CFOs, and consulting professionals.
How It Operates
- Step 1: Download the Excel file for Indian Oil Corporation Limited (IOCNS).
- Step 2: Review the pre-filled financial data and forecasts for IOCNS.
- Step 3: Adjust key inputs such as revenue growth, WACC, and tax rates (highlighted cells).
- Step 4: Observe the DCF model update in real-time as you modify assumptions.
- Step 5: Examine the outputs and utilize the results for your investment decisions.
Why Choose the IOCNS Calculator?
- Accuracy: Leverages real financial data from Indian Oil Corporation Limited for precise calculations.
- Flexibility: Allows users to easily experiment with and adjust their inputs.
- Time-Saving: Avoid the complexities of constructing a DCF model from the ground up.
- Professional-Grade: Crafted with the precision and usability expected at the CFO level.
- User-Friendly: Intuitive interface, accessible to those with minimal financial modeling expertise.
Who Can Benefit from This Product?
- Professional Investors: Create accurate and comprehensive valuation models for analyzing their portfolios with Indian Oil Corporation Limited (IOCNS).
- Corporate Finance Teams: Examine valuation scenarios that inform strategic decisions for the organization with insights from Indian Oil Corporation Limited (IOCNS).
- Consultants and Advisors: Deliver precise valuation analyses for clients interested in the performance of Indian Oil Corporation Limited (IOCNS).
- Students and Educators: Leverage real market data for financial modeling exercises and educational purposes, focusing on Indian Oil Corporation Limited (IOCNS).
- Energy Sector Enthusiasts: Gain insights into how Indian Oil Corporation Limited (IOCNS) is valued within the energy market landscape.
What the Template Contains
- Historical Data: Contains past financial information and baseline forecasts for Indian Oil Corporation Limited (IOCNS).
- DCF and Levered DCF Models: Comprehensive templates to determine the intrinsic value of Indian Oil Corporation Limited (IOCNS).
- WACC Sheet: Pre-calculated figures for the Weighted Average Cost of Capital.
- Editable Inputs: Adjust essential drivers such as growth rates, EBITDA percentages, and CAPEX forecasts.
- Quarterly and Annual Statements: A thorough presentation of Indian Oil Corporation Limited (IOCNS) financials.
- Interactive Dashboard: Dynamically visualize valuation outcomes and future projections.
Disclaimer
All information, articles, and product details provided on this website are for general informational and educational purposes only. We do not claim any ownership over, nor do we intend to infringe upon, any trademarks, copyrights, logos, brand names, or other intellectual property mentioned or depicted on this site. Such intellectual property remains the property of its respective owners, and any references here are made solely for identification or informational purposes, without implying any affiliation, endorsement, or partnership.
We make no representations or warranties, express or implied, regarding the accuracy, completeness, or suitability of any content or products presented. Nothing on this website should be construed as legal, tax, investment, financial, medical, or other professional advice. In addition, no part of this site—including articles or product references—constitutes a solicitation, recommendation, endorsement, advertisement, or offer to buy or sell any securities, franchises, or other financial instruments, particularly in jurisdictions where such activity would be unlawful.
All content is of a general nature and may not address the specific circumstances of any individual or entity. It is not a substitute for professional advice or services. Any actions you take based on the information provided here are strictly at your own risk. You accept full responsibility for any decisions or outcomes arising from your use of this website and agree to release us from any liability in connection with your use of, or reliance upon, the content or products found herein.