
|
Ion Exchange Limited (IONEXCHANG.NS) DCF Valuation |
Fully Editable: Tailor To Your Needs In Excel Or Sheets
Professional Design: Trusted, Industry-Standard Templates
Investor-Approved Valuation Models
MAC/PC Compatible, Fully Unlocked
No Expertise Is Needed; Easy To Follow
Ion Exchange (India) Limited (IONEXCHANG.NS) Bundle
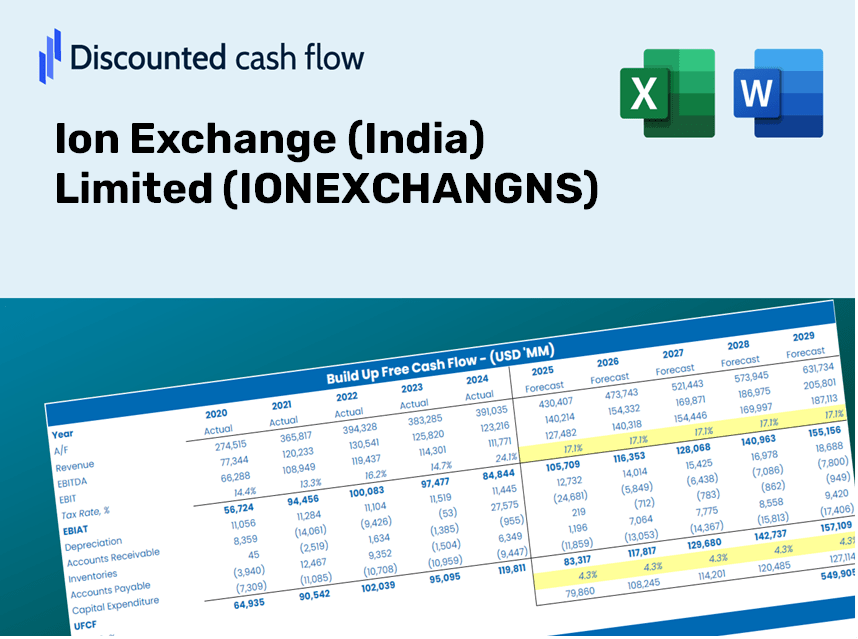
Gain insights into your Ion Exchange (India) Limited (IONEXCHANGNS) valuation analysis using our cutting-edge DCF Calculator! This Excel template comes preloaded with real (IONEXCHANGNS) data, enabling you to adjust forecasts and assumptions for an accurate calculation of Ion Exchange's intrinsic value.
Discounted Cash Flow (DCF) - (USD MM)
| Year | AY1 2021 |
AY2 2022 |
AY3 2023 |
AY4 2024 |
AY5 2025 |
FY1 2026 |
FY2 2027 |
FY3 2028 |
FY4 2029 |
FY5 2030 |
|---|---|---|---|---|---|---|---|---|---|---|
| Revenue | 14,465.7 | 15,723.2 | 19,896.1 | 23,478.5 | 27,371.1 | 32,148.6 | 37,759.9 | 44,350.7 | 52,091.9 | 61,184.2 |
| Revenue Growth, % | 0 | 8.69 | 26.54 | 18.01 | 16.58 | 17.45 | 17.45 | 17.45 | 17.45 | 17.45 |
| EBITDA | 2,375.0 | 2,576.3 | 2,989.1 | 3,192.3 | 3,424.3 | 4,753.7 | 5,583.5 | 6,558.0 | 7,702.7 | 9,047.1 |
| EBITDA, % | 16.42 | 16.39 | 15.02 | 13.6 | 12.51 | 14.79 | 14.79 | 14.79 | 14.79 | 14.79 |
| Depreciation | 276.7 | 280.4 | 290.9 | 364.1 | 444.9 | 535.9 | 629.4 | 739.3 | 868.3 | 1,019.9 |
| Depreciation, % | 1.91 | 1.78 | 1.46 | 1.55 | 1.63 | 1.67 | 1.67 | 1.67 | 1.67 | 1.67 |
| EBIT | 2,098.2 | 2,295.8 | 2,698.2 | 2,828.2 | 2,979.4 | 4,217.8 | 4,954.0 | 5,818.7 | 6,834.3 | 8,027.2 |
| EBIT, % | 14.5 | 14.6 | 13.56 | 12.05 | 10.89 | 13.12 | 13.12 | 13.12 | 13.12 | 13.12 |
| Total Cash | 3,364.8 | 5,362.1 | 3,400.1 | 3,699.8 | 4,662.1 | 6,895.5 | 8,099.1 | 9,512.7 | 11,173.1 | 13,123.3 |
| Total Cash, percent | .0 | .0 | .0 | .0 | .0 | .0 | .0 | .0 | .0 | .0 |
| Account Receivables | 4,715.6 | 5,406.4 | 7,667.6 | 9,909.7 | 11,392.5 | 12,174.7 | 14,299.8 | 16,795.7 | 19,727.3 | 23,170.6 |
| Account Receivables, % | 32.6 | 34.38 | 38.54 | 42.21 | 41.62 | 37.87 | 37.87 | 37.87 | 37.87 | 37.87 |
| Inventories | 1,275.9 | 1,809.6 | 2,222.6 | 2,365.4 | 2,989.9 | 3,375.5 | 3,964.7 | 4,656.7 | 5,469.5 | 6,424.2 |
| Inventories, % | 8.82 | 11.51 | 11.17 | 10.07 | 10.92 | 10.5 | 10.5 | 10.5 | 10.5 | 10.5 |
| Accounts Payable | 5,353.2 | 5,234.9 | 5,512.5 | 6,946.3 | 7,789.8 | 10,033.7 | 11,785.0 | 13,842.1 | 16,258.1 | 19,095.9 |
| Accounts Payable, % | 37.01 | 33.29 | 27.71 | 29.59 | 28.46 | 31.21 | 31.21 | 31.21 | 31.21 | 31.21 |
| Capital Expenditure | -299.5 | -500.2 | -598.5 | -1,203.3 | -3,203.9 | -1,613.3 | -1,894.9 | -2,225.6 | -2,614.0 | -3,070.3 |
| Capital Expenditure, % | -2.07 | -3.18 | -3.01 | -5.13 | -11.71 | -5.02 | -5.02 | -5.02 | -5.02 | -5.02 |
| Tax Rate, % | 26.95 | 26.95 | 26.95 | 26.95 | 26.95 | 26.95 | 26.95 | 26.95 | 26.95 | 26.95 |
| EBITAT | 1,548.4 | 1,719.5 | 2,052.0 | 2,061.7 | 2,176.4 | 3,127.0 | 3,672.8 | 4,313.9 | 5,066.9 | 5,951.3 |
| Depreciation | ||||||||||
| Changes in Account Receivables | ||||||||||
| Changes in Inventories | ||||||||||
| Changes in Accounts Payable | ||||||||||
| Capital Expenditure | ||||||||||
| UFCF | 887.3 | 157.0 | -652.2 | 271.2 | -1,846.3 | 3,125.7 | 1,444.5 | 1,696.7 | 1,992.8 | 2,340.6 |
| WACC, % | 5.26 | 5.26 | 5.27 | 5.26 | 5.26 | 5.26 | 5.26 | 5.26 | 5.26 | 5.26 |
| PV UFCF | ||||||||||
| SUM PV UFCF | 9,162.4 | |||||||||
| Long Term Growth Rate, % | 4.00 | |||||||||
| Free cash flow (T + 1) | 2,434 | |||||||||
| Terminal Value | 192,928 | |||||||||
| Present Terminal Value | 149,294 | |||||||||
| Enterprise Value | 158,456 | |||||||||
| Net Debt | -1,432 | |||||||||
| Equity Value | 159,888 | |||||||||
| Diluted Shares Outstanding, MM | 119 | |||||||||
| Equity Value Per Share | 1,348.64 |
What You Will Receive
- Authentic Ion Exchange Data: Comprehensive financials – from revenue to EBIT – utilizing actual and projected metrics.
- Complete Customization: Modify all essential parameters (yellow cells) such as WACC, growth %, and tax rates.
- Immediate Valuation Adjustments: Automatic recalculations to examine the effects of changes on Ion Exchange's fair value.
- Flexible Excel Template: Designed for swift modifications, scenario analysis, and thorough forecasts.
- Efficient and Precise: Avoid constructing models from the ground up while ensuring accuracy and adaptability.
Key Features
- Comprehensive Data: Ion Exchange’s historical financial statements and pre-populated forecasts.
- Customizable Parameters: Adjust WACC, tax rates, revenue growth, and EBITDA margins to fit your analysis.
- Real-Time Updates: Instantaneously see Ion Exchange’s intrinsic value recalculated.
- Intuitive Visualizations: Dashboard charts present valuation results and essential metrics clearly.
- Designed for Precision: A robust tool tailored for analysts, investors, and finance professionals.
How It Works
- Step 1: Download the prebuilt Excel template featuring Ion Exchange (India) Limited’s data.
- Step 2: Navigate through the pre-filled sheets to familiarize yourself with the essential metrics.
- Step 3: Modify forecasts and assumptions in the editable yellow cells (WACC, growth, margins).
- Step 4: Instantly observe recalculated results, including Ion Exchange (India) Limited’s intrinsic value.
- Step 5: Make well-informed investment decisions or create reports based on the outputs.
Why Choose This Calculator for Ion Exchange (India) Limited (IONEXCHANGNS)?
- Precision: Utilizes genuine financial data for unparalleled accuracy.
- Adaptability: Built for users to effortlessly adjust and test various inputs.
- Efficiency: Eliminate the complexities of creating a DCF model from the ground up.
- High-Quality Standards: Crafted with the expertise and usability considerations of top finance professionals.
- Intuitive Design: Simple to navigate, perfect for users without extensive financial modeling skills.
Who Can Benefit from This Product?
- Investors: Evaluate Ion Exchange (India) Limited's (IONEXCHANGNS) valuation before making stock decisions.
- CFOs and Financial Analysts: Enhance efficiency in valuation processes and refine financial forecasts.
- Startup Founders: Discover how established companies like Ion Exchange (India) Limited are valued in the market.
- Consultants: Prepare comprehensive valuation reports to assist clients effectively.
- Students and Educators: Utilize real data from Ion Exchange (India) Limited to practice and teach valuation methodologies.
What the Template Includes
- Preloaded IONEXCHANGNS Data: Historical and projected financial figures, encompassing revenue, EBIT, and capital expenditures.
- DCF and WACC Models: Advanced spreadsheets for determining intrinsic value and Weighted Average Cost of Capital.
- Editable Inputs: Cells highlighted in yellow for modifying revenue growth rates, tax rates, and discount rates.
- Financial Statements: Detailed annual and quarterly financials for thorough analysis.
- Key Ratios: Metrics on profitability, leverage, and efficiency to assess overall performance.
- Dashboard and Charts: Visual representations of valuation results and underlying assumptions.
Disclaimer
All information, articles, and product details provided on this website are for general informational and educational purposes only. We do not claim any ownership over, nor do we intend to infringe upon, any trademarks, copyrights, logos, brand names, or other intellectual property mentioned or depicted on this site. Such intellectual property remains the property of its respective owners, and any references here are made solely for identification or informational purposes, without implying any affiliation, endorsement, or partnership.
We make no representations or warranties, express or implied, regarding the accuracy, completeness, or suitability of any content or products presented. Nothing on this website should be construed as legal, tax, investment, financial, medical, or other professional advice. In addition, no part of this site—including articles or product references—constitutes a solicitation, recommendation, endorsement, advertisement, or offer to buy or sell any securities, franchises, or other financial instruments, particularly in jurisdictions where such activity would be unlawful.
All content is of a general nature and may not address the specific circumstances of any individual or entity. It is not a substitute for professional advice or services. Any actions you take based on the information provided here are strictly at your own risk. You accept full responsibility for any decisions or outcomes arising from your use of this website and agree to release us from any liability in connection with your use of, or reliance upon, the content or products found herein.