
|
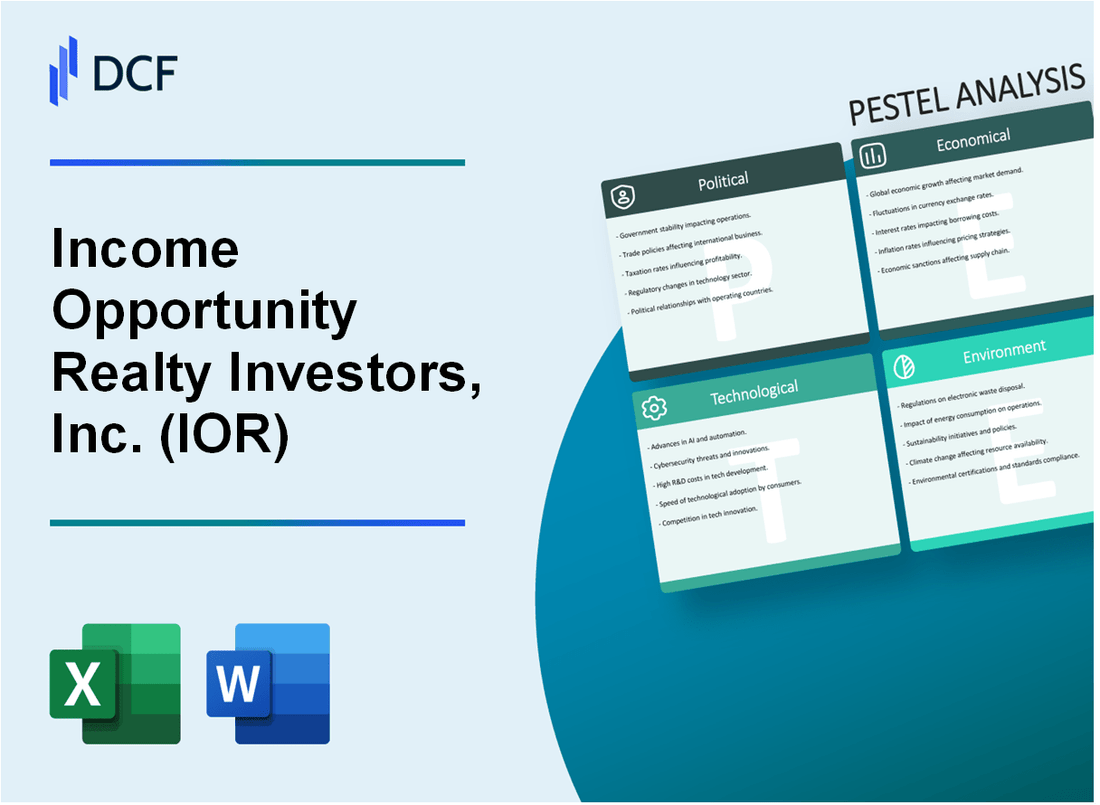
Income Opportunity Realty Investors, Inc. (IOR): PESTLE Analysis [Nov-2025 Updated] |
Fully Editable: Tailor To Your Needs In Excel Or Sheets
Professional Design: Trusted, Industry-Standard Templates
Investor-Approved Valuation Models
MAC/PC Compatible, Fully Unlocked
No Expertise Is Needed; Easy To Follow
Income Opportunity Realty Investors, Inc. (IOR) Bundle
You need to know exactly how the macro environment is shaping your investment in Income Opportunity Realty Investors, Inc. (IOR), and the reality is stark: we're in a late-cycle, high-interest-rate world where capital decisions are everything. Right now, the Federal Funds Rate holding near 5.50% is driving up refinancing costs, even as US inflation is projected to moderate to 3.2% by year-end 2025, which is a tricky defintely balance. The political push for rent control plus the massive shift to Sun Belt states and smart building tech cutting operating expenses by 10% to 15% are all creating a complex, high-stakes game. Let's break down the six critical forces-Political, Economic, Sociological, Technological, Legal, and Environmental-that will determine IOR's performance this year.
Income Opportunity Realty Investors, Inc. (IOR) - PESTLE Analysis: Political factors
You're looking for clarity on the political landscape, and honestly, the biggest takeaway for Income Opportunity Realty Investors, Inc. is that federal policy has provided a surprising amount of stability in 2025, but the real volatility is now entirely local. The federal government has locked in key tax benefits for Real Estate Investment Trusts (REITs), which is a huge win for long-term planning. But still, local political pressure on rent control and zoning is creating a defintely challenging environment for development and income growth.
Federal tax policy stability for Real Estate Investment Trusts (REITs) remains high.
The biggest political risk-the sunset of key tax provisions-was largely neutralized in mid-2025. The signing of the One Big Beautiful Bill Act (OBBBA) in July 2025 provided immediate and long-term certainty for REIT shareholders. This is a critical factor for IOR's investor base, as it supports the core value proposition of a REIT.
The most impactful change is the permanent extension of the 20% Qualified Business Income (QBI) deduction under Section 199A for REIT dividends. Here's the quick math: for a shareholder in the top bracket, this move preserves a maximum effective federal tax rate on ordinary REIT dividends of just 29.6%, down from the 37% rate before the deduction.
Also, the 2025 tax reform permanently restored 100% bonus depreciation for qualifying property placed in service on or after January 20, 2025, eliminating the planned phasedown to 40% for the year. This significantly enhances near-term cash flow for new development or substantial renovations.
| 2025 Federal Tax Policy Change | Impact on REITs (IOR) | Key Metric |
|---|---|---|
| Permanent Section 199A Deduction | Preserves favorable tax rate for shareholders. | Max effective tax rate: 29.6% |
| 100% Bonus Depreciation Restored (Jan 20, 2025+) | Accelerates depreciation, boosting near-term cash flow. | Depreciation rate: 100% (vs. 40% planned) |
| Section 163(j) Interest Deduction Relaxed | Increases deductible interest expense for debt-heavy ventures. | Calculation base shifted to EBITDA (from EBIT) |
| TRS Asset Limit Increase (Effective 2026) | Allows greater operational flexibility in taxable subsidiaries. | Limit increased from 20% to 25% of total assets |
Local zoning and permitting delays increase development costs and timelines.
While federal policy is stable, the local political environment is a major headwind, especially for development projects. Restrictive zoning and protracted entitlement processes are throttling supply and driving up costs. This is a political problem at the municipal level, where local land-use rules create significant barriers.
The delays are quantifiable. A McKinsey & Company study indicates that applying industrialized production methods to housing could accelerate project timelines by up to 50% and reduce costs by up to 20%, but restrictive local rules prevent this efficiency. Some jurisdictions are trying to adapt:
- Seattle, in September 2025, set new permit review deadlines to accelerate housing construction: Type Three permits (requiring public notice and hearing) are now capped at 170 days.
- Texas, effective September 1, 2025, raised the neighborhood protest threshold for rezoning to 60% of adjacent landowners, aiming to reduce project delays in urban areas like Austin and Dallas.
- Texas also locked impact fees for a three-year period, providing crucial cost certainty for developers' financial models.
What this estimate hides is the political risk of organized opposition, which can still jeopardize entire projects even with a clear legal path. You need to allocate more capital for political risk mitigation at the local level.
Increased political pressure for rent control measures in key urban markets.
The push for rent control is the single largest threat to the Net Operating Income (NOI) stability of IOR's multifamily assets. As of October 2025, three states-Oregon, Washington, and California-plus Washington, D.C., have some form of statewide rent control, with five other states allowing it locally. This trend is spreading.
The financial impact is clear, not just on income but on asset valuation. For example, in St. Paul, Minnesota, the 2021 introduction of rent control led to a 7% to 13% decline in the value of affected properties. New laws in 2025 show the trend is toward lower, stricter caps:
- Washington's law, effective May 7, 2025, limits annual rent increases to 7% plus the Consumer Price Index (CPI) or 10%, whichever is lower.
- A ballot measure in Massachusetts, potentially on the November 2026 ballot, would limit increases to CPI or 5%, whichever is lower.
This political pressure forces a strategic shift: focus investment on states with strong preemption laws or asset classes that are exempt, like new construction or non-residential properties.
Geopolitical stability affects investor sentiment and capital flows into US real estate.
Geopolitical instability is no longer a distant macro-factor; it directly impacts the cost of capital and transaction volume in 2025. BlackRock's global head of real estate research noted that elevated geopolitical risk and macro uncertainty are keeping the risk-free rate-like the US 10-year Treasury-high, which delays the real estate market's recovery.
This uncertainty has led many investors to adopt a 'wait-and-see' approach, which is restricting capital flows. For instance, following the U.S. government's block of Nippon Steel's $14.9 billion acquisition of U.S. Steel in January 2025, there was a visible 15% decline in foreign direct investment (FDI) into U.S. real estate sectors adjacent to national security zones. This shows that national security concerns are now a tangible factor in cross-border real estate valuation.
Geopolitics is a top three issue affecting global real estate investment, according to the Savills Impacts 2025 report. For IOR, this means a higher risk premium is being priced into transactions, which affects your ability to sell assets at peak valuations or secure foreign capital for large-scale projects.
Income Opportunity Realty Investors, Inc. (IOR) - PESTLE Analysis: Economic factors
The Federal Funds Rate is holding near 5.50%, driving up refinancing costs.
You need to look past the old high watermark for the Federal Funds Rate (the target rate banks use to lend to each other overnight) because the landscape has shifted dramatically in 2025. While the rate held near 5.50% for a long time, the Federal Reserve has executed cuts this year. The target range was lowered to 3.75%-4.00% following the October 2025 meeting, a move that followed a similar cut in September.
This easing is meant to relieve pressure, but borrowing costs are still high compared to the 2020-2021 period. For a company like Income Opportunity Realty Investors, Inc. (IOR), this means refinancing commercial real estate (CRE) debt-a major concern given the looming wall of maturities-remains expensive. The cost of capital is defintely elevated, forcing a tough look at every asset's cash flow.
Here's the quick math on the Fed's recent path:
- Fed Funds Target Range (October 2025): 3.75%-4.00%
- Projected Range (Year-End 2025): 3.5%-4.0%
- Impact: Higher interest expense on maturing debt, which is a significant risk given that more than $1.2 trillion in CRE loans are set to mature by the end of 2025.
Commercial Real Estate (CRE) valuations are under stress, especially office properties.
The Commercial Real Estate market is showing a clear split: industrial and multifamily are holding up, but office properties are in a crisis. This is a structural problem, not just a cyclical one. Office property values in the U.S. are expected to plunge a further 26% in 2025, compounding a 14% drop seen in 2024.
The core issue is the work-from-home trend, which has pushed the national office vacancy rate to a record high of 19.6% in Q1 2025. This high vacancy rate crushes net operating income (NOI), which in turn drives down valuations. For IOR, if their portfolio has significant exposure to older, non-Class A office space, the write-downs are inevitable. Class A trophy buildings are faring better, with vacancy rates about 500 basis points below the market average, but Class B and C assets are taking the brunt of the hit.
US inflation (CPI) is projected to moderate to 3.2% by year-end 2025.
While the initial outline suggested a 3.2% moderation, the actual data is running slightly better. The annual Consumer Price Index (CPI) inflation rate in the US was 3.0% in September 2025. This is still above the Federal Reserve's long-term 2% target, but it shows the monetary policy is working to cool the economy without causing a hard recession-a soft landing, if you will. The shelter component of the CPI, which is highly relevant to IOR, increased 3.6% over the 12 months ending September 2025.
This moderation is a double-edged sword. It reduces the chance of further aggressive rate hikes, which is great for financing costs. But, it also signals that the pricing power for rent increases in some sectors might be softening, particularly if the labor market continues to cool.
Slowing Gross Domestic Product (GDP) growth dampens leasing demand in some sectors.
The overall pace of economic activity is slowing, which directly impacts the demand side of the real estate equation. S&P Global Ratings forecasts U.S. real GDP growth to slow to 2% in 2025, down from 2.8% in 2024. The Federal Reserve Bank of Philadelphia's survey of forecasters has a median projection for real GDP growth at an annual rate of 1.9% for 2025.
This slowing growth, while modest, translates to less hiring and less business expansion. That means fewer companies are looking to expand their footprint, which directly dampens new leasing demand for office and retail properties. The labor market is still relatively healthy, but the unemployment rate is forecast to edge upward from 4.3% in Q3 of this year to 4.5% in the final quarter.
The modest growth outlook is a headwind for any real estate firm relying on robust expansion for rent growth.
Mortgage interest rates above 7.0% limit residential transaction volume.
The residential market, which affects the broader economy and IOR's residential holdings, is constrained by high rates. While the prompt suggested rates above 7.0%, the current reality is more nuanced, but still restrictive. As of November 2025, the average 30-year fixed mortgage rate for a purchase is in the range of 6.12% to 6.34%.
However, the average 30-year fixed refinance rate is higher, hovering around 6.74% to 6.75%. This is the real killer for transaction volume, as it locks in homeowners who bought or refinanced at the super-low 3%-4% rates of 2020 and 2021. They simply can't afford to move. This lack of inventory and high cost of financing limits residential transaction volume, which in turn reduces the potential for IOR to capitalize on residential-related opportunities.
Here is a summary of the key interest rate environment:
| Metric | Value (as of Nov 2025) | Impact on IOR's Business |
|---|---|---|
| Federal Funds Rate Target Range | 3.75%-4.00% | Increases cost of capital and refinancing risk. |
| 30-Year Fixed Mortgage Rate (Purchase) | 6.12%-6.34% | Limits residential transaction volume and housing demand. |
| 30-Year Fixed Mortgage Rate (Refinance) | 6.74%-6.75% | Drives low inventory as homeowners stay put. |
| US CPI Inflation (September 2025) | 3.0% | Moderates financing risk but suggests softening rent pricing power. |
| US Real GDP Growth Forecast (2025) | 1.9%-2.0% | Dampens corporate expansion and new leasing demand. |
Income Opportunity Realty Investors, Inc. (IOR) - PESTLE Analysis: Social factors
You're looking at the social landscape, and honestly, it's where the biggest tailwinds for Income Opportunity Realty Investors, Inc. (IOR) are coming from right now. The pandemic didn't just change how we work; it fundamentally shifted where we live and shop. IOR's focus on notes receivable collateralized by land and/or multifamily properties, plus their grocery-anchored retail centers in secondary markets, positions them well to capitalize on these permanent demographic shifts. They are defintely in the right place at the right time.
Persistent work-from-home (WFH) trends reduce demand for traditional office space.
The long-term shift to hybrid and remote work has created a structural headwind for central business district (CBD) office properties, but it's a net positive for IOR's core business. While the overall US office market saw a value decrease of $557 billion between December 2019 and December 2023, the key for IOR is that they don't own much, if any, of that struggling asset class.
Instead, the WFH trend pushes people out of expensive urban cores and into the suburbs and smaller markets, exactly where IOR's grocery-anchored retail centers thrive. These centers serve the daily needs of a newly resident population. Experts project US office vacancy rates will reach 19% by 2025, which is a clear sign that capital will continue to flow out of that sector and into resilient asset classes like essential retail and multifamily, which are the underlying collateral for IOR's notes receivable.
- Office vacancy rates hit a 2025 projection of 19%.
- Suburban areas outperform urban cores in property value growth.
- Demand for local, convenience-based retail is rising.
Strong demographic shift toward Sun Belt states drives multifamily and industrial demand.
This is where IOR's Dallas base and investment focus give them a real edge. The Sun Belt region is the undisputed champion of US population growth. The region accounted for a massive 80% of total U.S. population growth over the last decade, and it's projected to add another 11 million people, or 7.3% growth, in the next decade.
Texas alone, where IOR is headquartered, added approximately 560,000 residents in 2024. This sustained influx creates insatiable demand for housing (multifamily) and the logistics facilities (industrial) needed to serve them. This demographic reality provides a strong foundational support for the value of the land and multifamily notes that make up a portion of IOR's portfolio. The demand for single-family rentals, often a step up from multifamily, has also seen prices jump about 41% since pre-pandemic levels, substantially outpacing the 26% rise in multi-family rents. Here's the quick math: more people equals more demand for everything IOR's assets touch.
Increased focus on Environmental, Social, and Governance (ESG) investing by institutional capital.
ESG is no longer a niche concept; it's a core capital allocation filter. Approximately one in four dollars under professional management in the U.S.-about $12 trillion-now follows ESG considerations. This matters because institutional investors, the primary source of capital for large-scale real estate, are demanding transparency and performance on these metrics.
For IOR, the 'S' (Social) factor is particularly relevant. The company's focus on essential, neighborhood-serving retail (grocery-anchored centers) and affordable housing collateral (multifamily notes) aligns well with the social aspect of ESG, specifically community impact and access to necessities. However, the 'E' (Environmental) and 'G' (Governance) still require attention. For instance, 46% of investors say climate risk directly affects their investment choices, meaning IOR needs to demonstrate a plan for energy efficiency or climate resilience for its properties and collateral.
| ESG Factor | Institutional Capital Trend (2025) | Implication for IOR |
|---|---|---|
| Total U.S. Assets Under ESG Management | Approximately $12 trillion (1 in 4 dollars). | Access to a massive pool of institutional capital requires ESG compliance and reporting. |
| Climate Risk Impact on Investment | 46% of investors say it affects their choices. | Need to assess and mitigate physical climate risk for Sun Belt assets. |
| Green Building Premium | Green-certified buildings command higher rents/occupancy. | Opportunity to upgrade retail centers for higher valuations and lower default risk. |
Affordability crisis pushes demand for lower-cost, suburban housing options.
The US housing affordability crisis is accelerating, pushing middle-income earners further out of urban and even inner-ring suburban areas. This is a direct engine for IOR's business model. As of Q3 2025, the median home sale price in suburban counties reached $385,000, an increase of 48.9% since before the pandemic.
This price surge means the annual income required to afford a median-priced home in suburban counties has climbed to $102,120, up 90.9% from pre-pandemic levels. This massive jump in required income is driving two key outcomes that benefit IOR:
- Increased Renter Pool: More people are priced out of buying, boosting demand for rental properties, which are the collateral for IOR's notes receivable.
- Suburban Retail Resilience: The new, larger suburban population needs local services, reinforcing the stability of IOR's grocery-anchored retail centers in those secondary markets.
The affordability issue is so acute that it's accelerating fastest in rural America, where the income needed to afford a median-priced home is up a staggering 105.8% since 2019, to $74,508 as of Q3 2025. This suggests that the search for lower-cost living will continue to push demand into the smaller, more affordable markets, which is right in IOR's wheelhouse.
Income Opportunity Realty Investors, Inc. (IOR) - PESTLE Analysis: Technological factors
You're looking at the real estate market in 2025, and honestly, technology isn't just an expense line item anymore-it's the biggest lever for margin improvement and risk mitigation. For Income Opportunity Realty Investors, Inc. (IOR), which reported total operating expenses of $97,000 (in thousands) for the second quarter of 2025, the right tech adoption could translate directly into a stronger bottom line, but the wrong move could expose your entire portfolio to new cyber threats. It's a high-stakes trade-off.
Widespread adoption of smart building technology cuts operating expenses by 10% to 15%.
The move to smart building technology, or PropTech (Property Technology), is now table stakes, not a luxury. These systems-IoT sensors, automated HVAC, and intelligent lighting-are designed to optimize energy consumption and maintenance. For commercial real estate owners, deploying integrated building management and analytics platforms can cut overall operating costs by up to 30%, but a more conservative, achievable range for companies like IOR is a reduction of 10% to 15% annually.
Here's the quick math: if IOR's reported Q2 2025 operating expenses of $97,000 (in thousands) were annualized, even a 10% saving would free up significant capital for new investments. This isn't just about utility bills; predictive maintenance alone can cut equipment downtime by 50% and overall maintenance costs by up to 30%. You simply can't afford to be reactive when the technology exists to be proactive.
Use of Artificial Intelligence (AI) in property management streamlines tenant screening and maintenance.
Artificial Intelligence (AI) has moved from a pilot project to a core operational tool in property management. The adoption rate of AI by property management companies jumped significantly, increasing from 21% in 2024 to 34% in 2025. AI-driven platforms are transforming the two most time-consuming aspects of property management: tenant relations and physical maintenance.
Specifically, AI-driven property management platforms are proving their value by cutting maintenance costs by as much as 14%, while also boosting rental income by up to 9% through dynamic pricing optimization. For IOR, this means faster, more accurate tenant screening-reducing default risk-and predictive maintenance that flags an HVAC problem before it becomes an emergency. Operational efficiency improvements of 30% to 40% are commonly reported after implementing these systems. You're not replacing your team, you're giving them a defintely better tool.
- Tenant Screening: AI analyzes credit, income stability, and rental history to predict tenant behavior.
- Predictive Maintenance: AI uses sensor data to anticipate equipment failure, reducing costly emergency repairs.
- Pricing Optimization: Algorithms adjust rental rates in real-time based on market data and demand patterns.
PropTech platforms improve transaction transparency, but also increase competitive pricing pressure.
The global PropTech market is a massive, and rapidly expanding, ecosystem. It was valued at approximately $40.19 billion in 2025 and is projected to more than double to $88.37 billion by 2032. This growth is fueled by platforms that digitize everything from property search to financing and asset management, which is great for transparency and speed.
But still, this transparency is a double-edged sword. As platforms like CoStar Group (which acquired Matterport in February 2025) integrate 3D digital-twin technology with extensive property data, the market becomes far more efficient. This means every competitor, from institutional investors to individual buyers, has near-perfect information on comparable sales, local trends, and property performance. This increased data visibility intensifies competitive pricing pressure on IOR's assets, making it harder to extract alpha from undervalued properties.
Cybersecurity risks are rising due to increased reliance on interconnected building systems.
The convergence of physical infrastructure and digital systems creates a massive new attack surface. By 2025, an estimated over 1 billion IoT devices will be deployed in smart buildings globally. These connected systems-HVAC, lighting, access controls-were often not designed with robust security, making them a prime entry point for cybercriminals.
The risks are no longer theoretical. The cost of recovering from a ransomware attack in the real estate and construction sectors has surged to an average of $2.73 million per incident, not even including the ransom itself. IOR needs to shift its security focus from just traditional IT (laptops and email) to Operational Technology (OT) systems in its buildings. This is a critical risk you must address immediately.
| Technological Factor | Impact on IOR (2025 Perspective) | Key Metric / Data Point |
|---|---|---|
| Smart Building Adoption | Opportunity to reduce operational costs and meet ESG mandates. | Potential operating cost reduction of 10% to 15% annually. |
| AI in Property Management | Opportunity for efficiency gains in leasing and maintenance. | AI adoption by property managers increased from 21% to 34% in 2025. |
| PropTech Market Growth | Increased market efficiency leads to higher competitive pricing pressure. | Global PropTech market projected at $40.19 billion in 2025. |
| Cybersecurity for OT/IoT | Significant new risk from interconnected operational systems. | Average cost to recover from ransomware is $2.73 million per incident. |
Next Step: Operations: Commission a third-party audit of all building Operational Technology (OT) and IoT systems to identify unpatched vulnerabilities and legacy systems by the end of Q4 2025.
Income Opportunity Realty Investors, Inc. (IOR) - PESTLE Analysis: Legal factors
You need to be a trend-aware realist when looking at the legal landscape for a company like Income Opportunity Realty Investors, Inc. (IOR). The legal environment isn't just about avoiding lawsuits; it's about managing a rising tide of compliance costs and regulatory complexity that directly eats into your net income. For IOR, which reported net income of $1.0 million for the quarter ended September 30, 2025, even a small increase in administrative burden is a material risk.
The core legal challenge for IOR in 2025 is the convergence of federal disclosure mandates, state-level tenant protection laws, and the ongoing fallout from distressed commercial debt. You can't sidestep any of this; you just have to budget for the compliance and litigation risk.
Stricter Securities and Exchange Commission (SEC) disclosure rules for climate-related risks.
The SEC's final Climate Disclosure Rules, adopted in March 2024, are now a real-world compliance factor for public companies like IOR. While the largest companies (Large Accelerated Filers) started compliance in 2025, all registrants must prepare for the new requirements, which focus on disclosing material climate-related risks and their financial impact. The SEC estimates that the compliance costs for the new governance, strategy, and risk management disclosures will be around $327,000 in the first year alone, with subsequent annual costs of approximately $183,000.
Here's the quick math: if IOR's quarterly net income is around $1.0 million, that initial compliance cost represents a significant, one-time drain on resources, even if IOR qualifies as a smaller filer with a public float of $365.79k. The rule requires IOR to quantify material expenditures and impacts resulting from severe weather events (physical risk) or transition activities (transition risk), which directly impacts its financial statements.
- Quantify the actual material costs from severe weather events.
- Describe the governance and oversight of climate-related risks.
- Disclose material expenditures for climate risk mitigation or adaptation.
New state-level tenant protection laws complicate lease agreements and eviction processes.
IOR's portfolio includes investments in real estate and notes collateralized by multifamily properties, which puts it directly in the crosshairs of new state-level tenant protection laws. Historically, commercial real estate leases enjoyed fewer statutory protections than residential ones, but that is changing fast. For instance, California's SB 1103, effective January 1, 2025, extends significant rights to 'qualified commercial tenants' (like microenterprises and small nonprofits).
This law complicates the eviction process and increases the financial risk of non-compliance. Landlords must now provide a minimum of 90 days' notice for any rent increase exceeding 10% of the rent charged in the previous 12 months. What this estimate hides is the potential for litigation: a landlord's violation of these new rules can be met with a separate civil action seeking up to treble (triple) damages and statutory attorney's fees.
Also, in states like Illinois, the Landlord Retaliation Act, effective January 1, 2025, creates a rebuttable presumption of retaliation if a landlord takes adverse action (like terminating a lease or increasing rent) within one year of a tenant's good-faith complaint. [cite: 7 in first search] This adds a layer of legal complexity to routine property management decisions.
Litigation risk rises from distressed commercial mortgage-backed securities (CMBS) defaults.
IOR holds a portfolio of notes receivable, which exposes it to the broader distress in the commercial real estate debt market, particularly with Commercial Mortgage-Backed Securities (CMBS). The risk of litigation is rising as lenders become less forgiving and foreclosure starts tick up. [cite: 15 in first search] As of August 2025, a staggering $69 billion of CMBS loans were with special servicers, indicating significant distress and a high potential for complex legal workouts and litigation. [cite: 6 in first search]
The combined rate of delinquent and/or specially serviced CMBS loans has been stubbornly high, hovering between 10% and 12% throughout 2025, a sharp contrast to the sub-5% levels seen in 2022. [cite: 14 in first search] The office sector is driving much of this distress, with a delinquency rate of 10.3% in 2025. [cite: 15 in first search] Even though IOR focuses on retail and multifamily collateral, the systemic distress increases counterparty risk and the cost of resolving defaulted notes receivable in its portfolio.
Compliance costs increase due to evolving data privacy regulations (e.g., CCPA).
Data privacy regulations, especially the California Consumer Privacy Act (CCPA) and its amendments, are a growing compliance headache for any business operating in the US, including real estate companies that collect tenant, employee, and vendor data. The compliance burden is increasing because the thresholds and penalties are rising.
Effective January 1, 2025, the annual gross revenue threshold for a business to be covered by the CCPA has been increased to $26,625,000. [cite: 8, 13 in first search] Given IOR's market capitalization of $72.38 million, it is defintely subject to the Act.
The financial risk is now higher: administrative fines for each intentional violation have been increased to a maximum of $7,988. [cite: 8, 13 in first search] This forces IOR to invest more heavily in data mapping, consumer request handling systems (like the Right to Know and Right to Delete), and legal counsel to update its privacy policy and data retention practices. You must treat this as a non-negotiable operational cost.
| Regulation | 2025 Financial/Compliance Impact | Actionable Risk for IOR |
|---|---|---|
| SEC Climate Disclosure Rules | Estimated 1st-year compliance cost: $327,000 | Increased G&A expenses; risk of restatements if climate-related financial impacts are miscalculated. |
| CMBS Distress/Litigation | Combined Delinquent/Specially Serviced Rate: 10%-12% in 2025 [cite: 14 in first search] | Higher risk of loss on notes receivable; increased legal costs for debt restructuring and foreclosure proceedings. |
| CA Commercial Tenant Law (SB 1103) | Potential for treble damages for violations; 90-day rent increase notice for small tenants [cite: 4, 1 in first search] | Complicated lease negotiation; higher litigation exposure in property management; delayed evictions. |
| CCPA Data Privacy | Intentional violation fine up to $7,988 per incident [cite: 8 in first search]; Revenue threshold: $26,625,000 [cite: 8 in first search] | Mandatory investment in IT security and data governance; material fine risk for non-compliance with consumer rights requests. |
Income Opportunity Realty Investors, Inc. (IOR) - PESTLE Analysis: Environmental factors
Rising insurance premiums due to increased frequency of severe weather events.
The core risk for Income Opportunity Realty Investors, Inc. (IOR) in 2025 is the accelerating cost of property insurance, which is directly tied to climate-driven severe weather events. Insurers are adjusting pricing models to reflect higher loss patterns, especially in regions prone to natural disasters. For property owners in high-risk zip codes, average home insurance premiums paid were 82% more than those in the lowest climate-risk zip codes between 2018 and 2022.
This trend impacts IOR's net operating income (NOI) directly, especially since their portfolio includes office, retail, and industrial properties. The National Oceanic and Atmospheric Administration (NOAA) projected a 60% chance of an above-normal 2025 Atlantic hurricane season, with a forecast of 13-19 total named storms. Meanwhile, regions like Colorado saw over 185 reports of 2-inch or larger hailstorms in 2024, a significant jump from 91 in 2018, contributing to sustained rate hikes. This isn't just a coastal problem; it's a nationwide exposure.
Here's the quick math: if your insurance cost rises 15% in a year, that cuts straight into your bottom line, and you defintely can't pass all of it to tenants.
- Risk Driver: Rising reconstruction costs have surged over 50% from 2020 to 2024 due to inflation and labor shortages, forcing premiums higher.
- Exposure: The increase in severe events like wildfires (e.g., California, January 2025) and hail/windstorms (e.g., Texas, Colorado) puts continuous pressure on IOR's property insurance capacity.
Mandates for energy-efficient building standards require significant capital expenditure for retrofits.
Regulatory pressure from local and state governments is forcing commercial real estate owners to invest heavily in energy efficiency retrofits (modernizing existing buildings). To meet net-zero targets, the U.S. will need to triple its current retrofit rate to between 3% and 3.5% of existing stock per year. For IOR, with a total asset value of $692 million (as of 2023), capital expenditure (CapEx) for these upgrades is a major near-term consideration.
The financial opportunity lies in the savings: deep retrofits of whole office buildings can yield energy efficiency savings of 40% to 60%, which drastically reduces operating expenses over time. However, a critical risk emerged in July 2025 with a new federal bill that slashes incentives for energy efficiency and repeals key programs like the Energy Efficient Commercial Buildings Deduction (179D) for projects commencing construction after June 30, 2026. This shift means IOR must accelerate its CapEx decisions to capture remaining incentives, or face the full cost of compliance later. The US energy retrofit systems market is expected to grow at a CAGR of 6.8% from 2024 to 2030, indicating a clear market direction despite federal headwinds.
Increased scrutiny on water usage and waste management practices in property operations.
Scrutiny on water usage and waste management is becoming a key operational and valuation factor, moving from a 'nice-to-have' to a 'must-manage' cost. In major metropolitan areas, water and sewer rates are rising to fund critical, aging infrastructure upgrades. For example, Baltimore City proposed a rate adjustment that would increase the monthly water bill by 9.66% starting February 1, 2025, to support a $1.9 billion six-year improvement program. Similarly, Seattle's residential and commercial water rates are increasing by an average of 2.0% in 2025.
In water-stressed regions, like California, new urban water conservation regulations took effect on January 1, 2025, requiring suppliers to develop water budgets and meet water use objectives by 2027. This regulatory environment forces IOR to prioritize water-efficient fixtures and xeriscaping, especially in its retail and office properties, to avoid future restrictions or higher volumetric charges. On the waste side, the U.S. waste management market size is projected to reach $224.9 million in 2025 and is driven by stricter state-level regulations mandating segregation and recycling. Proactive waste reduction can reduce hauling costs and enhance sustainability, which is increasingly factored into tenant leasing decisions.
Demand for green-certified buildings (e.g., LEED) commands a rental premium of up to 5%.
The demand for green-certified buildings, such as those with Leadership in Energy and Environmental Design (LEED) certification, is a clear opportunity to drive higher revenue for IOR's property portfolio. Green-certified Class A office spaces are commanding a rental premium of nearly 12% across eight major U.S. and Canadian markets, according to a JLL study.
While the average premium for LEED-certified buildings, after controlling for factors like age and location, is often cited around 3.7%, the higher end for prime assets is a strong incentive for CapEx. This premium is driven by corporate tenants-especially in finance and professional services-who have their own carbon commitments and are seeking spaces that align with their Environmental, Social, and Governance (ESG) goals.
The certification also translates into higher asset value, with some studies showing an 8% to 10% increase in asset value over an identical non-certified asset. This valuation uplift is critical for a real estate investment company like IOR.
| Environmental Factor | 2025 Financial/Operational Impact | Actionable Insight for IOR |
|---|---|---|
| Property Insurance Premiums | Average homeowners' insurance premium increased 8.7% faster than inflation (2018-2022). 60% chance of above-normal 2025 Atlantic hurricane season. | Action: Increase insurance deductible to manage premium costs, and invest in property-level resilience (e.g., storm-resistant roofing) to qualify for lower rates. |
| Energy Efficiency Retrofits | Deep retrofits yield 40% to 60% energy savings. Federal tax incentives are being repealed for projects commencing after June 30, 2026. | Action: Immediately audit the $692 million portfolio to identify high-ROI deep retrofit projects and fast-track CapEx before the June 2026 incentive cutoff. |
| Water/Waste Management Costs | Municipal water rate increases up to 9.66% in cities like Baltimore (FY2025). New state regulations (e.g., California) mandate water use objectives by 2027. | Action: Implement low-flow fixtures and smart irrigation across all properties, especially in the 30% retail and 45% office segments, to mitigate rising utility costs. |
| Green Building Demand (LEED) | Green certified Class A office spaces command a rental premium of nearly 12%. Asset value can increase by 8% to 10%. | Action: Target LEED certification for high-value office assets to capture the 12% rental premium and enhance long-term asset valuation. |
Finance: draft a 12-month environmental CapEx budget by Friday, prioritizing energy retrofits to beat the federal incentive deadline.
Disclaimer
All information, articles, and product details provided on this website are for general informational and educational purposes only. We do not claim any ownership over, nor do we intend to infringe upon, any trademarks, copyrights, logos, brand names, or other intellectual property mentioned or depicted on this site. Such intellectual property remains the property of its respective owners, and any references here are made solely for identification or informational purposes, without implying any affiliation, endorsement, or partnership.
We make no representations or warranties, express or implied, regarding the accuracy, completeness, or suitability of any content or products presented. Nothing on this website should be construed as legal, tax, investment, financial, medical, or other professional advice. In addition, no part of this site—including articles or product references—constitutes a solicitation, recommendation, endorsement, advertisement, or offer to buy or sell any securities, franchises, or other financial instruments, particularly in jurisdictions where such activity would be unlawful.
All content is of a general nature and may not address the specific circumstances of any individual or entity. It is not a substitute for professional advice or services. Any actions you take based on the information provided here are strictly at your own risk. You accept full responsibility for any decisions or outcomes arising from your use of this website and agree to release us from any liability in connection with your use of, or reliance upon, the content or products found herein.