
|
IQVIA Holdings Inc. (IQV) DCF Valuation |
Fully Editable: Tailor To Your Needs In Excel Or Sheets
Professional Design: Trusted, Industry-Standard Templates
Investor-Approved Valuation Models
MAC/PC Compatible, Fully Unlocked
No Expertise Is Needed; Easy To Follow
IQVIA Holdings Inc. (IQV) Bundle
Take charge of your IQVIA Holdings Inc. (IQV) valuation analysis using our sophisticated DCF Calculator! Fully equipped with authentic IQV data, this Excel template enables you to adjust forecasts and assumptions to accurately compute the intrinsic value of IQVIA Holdings Inc. (IQV).
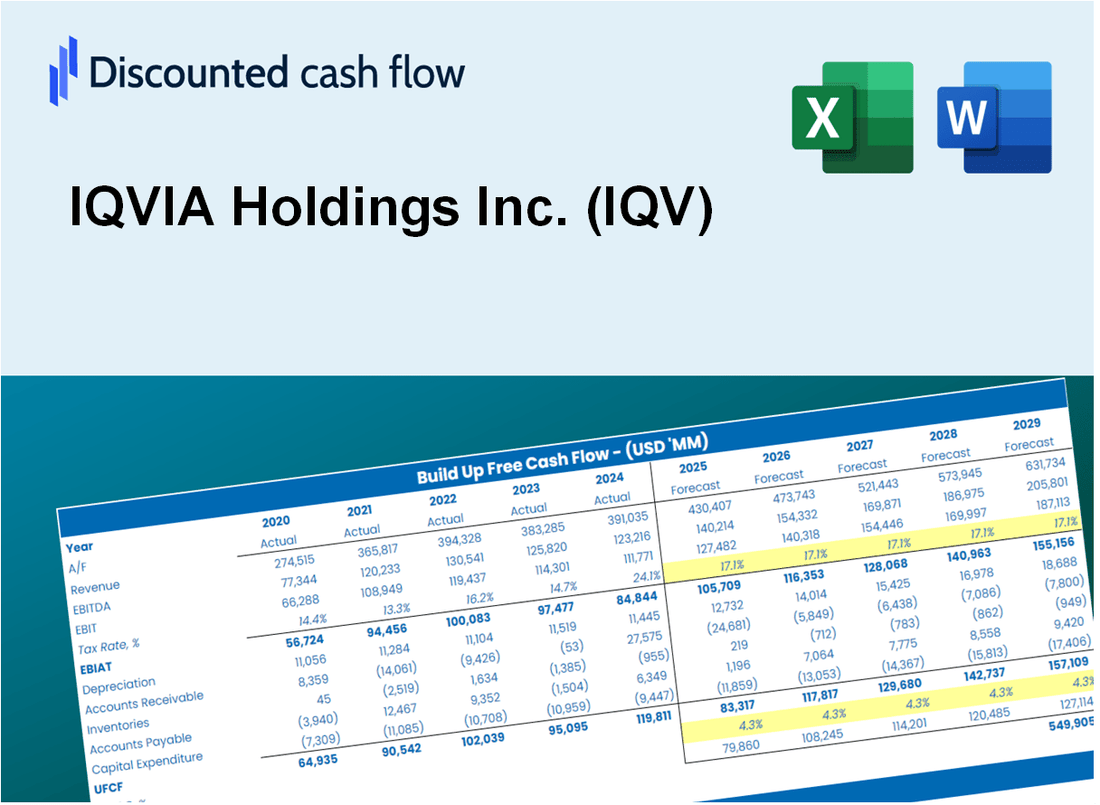
Discounted Cash Flow (DCF) - (USD MM)
| Year | AY1 2020 |
AY2 2021 |
AY3 2022 |
AY4 2023 |
AY5 2024 |
FY1 2025 |
FY2 2026 |
FY3 2027 |
FY4 2028 |
FY5 2029 |
|---|---|---|---|---|---|---|---|---|---|---|
| Revenue | 11,359.0 | 13,874.0 | 14,410.0 | 14,984.0 | 15,405.0 | 16,668.1 | 18,034.8 | 19,513.5 | 21,113.5 | 22,844.7 |
| Revenue Growth, % | 0 | 22.14 | 3.86 | 3.98 | 2.81 | 8.2 | 8.2 | 8.2 | 8.2 | 8.2 |
| EBITDA | 2,076.0 | 2,767.0 | 2,909.0 | 3,256.0 | 3,453.0 | 3,418.7 | 3,699.0 | 4,002.3 | 4,330.5 | 4,685.5 |
| EBITDA, % | 18.28 | 19.94 | 20.19 | 21.73 | 22.41 | 20.51 | 20.51 | 20.51 | 20.51 | 20.51 |
| Depreciation | 1,287.0 | 1,264.0 | 1,130.0 | 1,125.0 | 1,114.0 | 1,434.2 | 1,551.8 | 1,679.0 | 1,816.7 | 1,965.6 |
| Depreciation, % | 11.33 | 9.11 | 7.84 | 7.51 | 7.23 | 8.6 | 8.6 | 8.6 | 8.6 | 8.6 |
| EBIT | 789.0 | 1,503.0 | 1,779.0 | 2,131.0 | 2,339.0 | 1,984.5 | 2,147.2 | 2,323.3 | 2,513.8 | 2,719.9 |
| EBIT, % | 6.95 | 10.83 | 12.35 | 14.22 | 15.18 | 11.91 | 11.91 | 11.91 | 11.91 | 11.91 |
| Total Cash | 1,902.0 | 1,477.0 | 1,309.0 | 1,496.0 | 1,843.0 | 1,947.6 | 2,107.3 | 2,280.0 | 2,467.0 | 2,669.3 |
| Total Cash, percent | .0 | .0 | .0 | .0 | .0 | .0 | .0 | .0 | .0 | .0 |
| Account Receivables | 2,466.0 | 2,609.0 | 2,960.0 | 3,413.0 | 3,240.0 | 3,495.8 | 3,782.5 | 4,092.6 | 4,428.2 | 4,791.2 |
| Account Receivables, % | 21.71 | 18.8 | 20.54 | 22.78 | 21.03 | 20.97 | 20.97 | 20.97 | 20.97 | 20.97 |
| Inventories | .0 | .0 | .0 | .0 | .0 | .0 | .0 | .0 | .0 | .0 |
| Inventories, % | 0 | 0 | 0 | 0 | 0 | 0 | 0 | 0 | 0 | 0 |
| Accounts Payable | 581.0 | 621.0 | 645.0 | 709.0 | 736.0 | 785.9 | 850.4 | 920.1 | 995.6 | 1,077.2 |
| Accounts Payable, % | 5.11 | 4.48 | 4.48 | 4.73 | 4.78 | 4.72 | 4.72 | 4.72 | 4.72 | 4.72 |
| Capital Expenditure | -616.0 | -640.0 | -674.0 | -649.0 | -602.0 | -765.1 | -827.9 | -895.8 | -969.2 | -1,048.7 |
| Capital Expenditure, % | -5.42 | -4.61 | -4.68 | -4.33 | -3.91 | -4.59 | -4.59 | -4.59 | -4.59 | -4.59 |
| Tax Rate, % | 17.74 | 17.74 | 17.74 | 17.74 | 17.74 | 17.74 | 17.74 | 17.74 | 17.74 | 17.74 |
| EBITAT | 579.3 | 1,280.3 | 1,436.6 | 1,983.5 | 1,924.2 | 1,646.0 | 1,780.9 | 1,926.9 | 2,084.9 | 2,255.9 |
| Depreciation | ||||||||||
| Changes in Account Receivables | ||||||||||
| Changes in Inventories | ||||||||||
| Changes in Accounts Payable | ||||||||||
| Capital Expenditure | ||||||||||
| UFCF | -634.7 | 1,801.3 | 1,565.6 | 2,070.5 | 2,636.2 | 2,109.1 | 2,282.6 | 2,469.8 | 2,672.3 | 2,891.4 |
| WACC, % | 8.48 | 8.62 | 8.57 | 8.72 | 8.59 | 8.6 | 8.6 | 8.6 | 8.6 | 8.6 |
| PV UFCF | ||||||||||
| SUM PV UFCF | 9,642.2 | |||||||||
| Long Term Growth Rate, % | 4.00 | |||||||||
| Free cash flow (T + 1) | 3,007 | |||||||||
| Terminal Value | 65,429 | |||||||||
| Present Terminal Value | 43,321 | |||||||||
| Enterprise Value | 52,963 | |||||||||
| Net Debt | 12,454 | |||||||||
| Equity Value | 40,509 | |||||||||
| Diluted Shares Outstanding, MM | 183 | |||||||||
| Equity Value Per Share | 220.88 |
What You Will Get
- Editable Excel Template: A fully customizable Excel-based DCF Calculator featuring pre-filled real IQV financials.
- Real-World Data: Historical data and forward-looking estimates (as represented in the yellow cells).
- Forecast Flexibility: Adjust forecast assumptions such as revenue growth, EBITDA %, and WACC.
- Automatic Calculations: Instantly observe the effect of your inputs on IQVIA's valuation.
- Professional Tool: Designed for investors, CFOs, consultants, and financial analysts.
- User-Friendly Design: Organized for clarity and ease of use, complete with step-by-step instructions.
Key Features
- Real-Life IQV Data: Pre-filled with IQVIA Holdings Inc.'s historical financials and forward-looking projections.
- Fully Customizable Inputs: Adjust revenue growth, margins, WACC, tax rates, and capital expenditures.
- Dynamic Valuation Model: Automatic updates to Net Present Value (NPV) and intrinsic value based on your inputs.
- Scenario Testing: Create multiple forecast scenarios to analyze different valuation outcomes.
- User-Friendly Design: Simple, structured, and designed for professionals and beginners alike.
How It Works
- Download the Template: Gain immediate access to the Excel-based IQV DCF Calculator.
- Input Your Assumptions: Modify the yellow-highlighted cells for growth rates, WACC, margins, and other variables.
- Instant Calculations: The model automatically recalculates IQV’s intrinsic value.
- Test Scenarios: Experiment with various assumptions to assess potential valuation shifts.
- Analyze and Decide: Leverage the results to inform your investment or financial analysis.
Why Choose IQVIA Holdings Inc. (IQV)?
- Innovative Solutions: Access cutting-edge analytics and technology tailored for the healthcare sector.
- Data-Driven Insights: Leverage comprehensive datasets to enhance decision-making and strategy.
- Global Expertise: Benefit from a team of professionals with extensive industry knowledge and experience.
- Customizable Services: Adapt our solutions to meet your unique business needs and objectives.
- Proven Track Record: Trusted by leading organizations for delivering high-quality results and value.
Who Should Use This Product?
- Healthcare Investors: Construct comprehensive and accurate valuation models for portfolio assessment related to IQVIA Holdings Inc. (IQV).
- Corporate Strategy Teams: Evaluate valuation scenarios to inform strategic decisions within healthcare sectors.
- Consultants and Advisors: Deliver precise valuation insights for clients interested in IQVIA Holdings Inc. (IQV).
- Students and Educators: Utilize real-time data to enhance learning and practice in financial modeling within the healthcare industry.
- Data Science Enthusiasts: Gain insights into how companies like IQVIA Holdings Inc. (IQV) are valued in the evolving healthcare market.
What the Template Contains
- Comprehensive DCF Model: Editable template featuring thorough valuation calculations.
- Real-World Data: IQVIA's historical and projected financials preloaded for in-depth analysis.
- Customizable Parameters: Modify WACC, growth rates, and tax assumptions to explore different scenarios.
- Financial Statements: Complete annual and quarterly breakdowns for enhanced insights.
- Key Ratios: Integrated analysis for profitability, efficiency, and leverage metrics.
- Dashboard with Visual Outputs: Charts and tables providing clear, actionable results.
Disclaimer
All information, articles, and product details provided on this website are for general informational and educational purposes only. We do not claim any ownership over, nor do we intend to infringe upon, any trademarks, copyrights, logos, brand names, or other intellectual property mentioned or depicted on this site. Such intellectual property remains the property of its respective owners, and any references here are made solely for identification or informational purposes, without implying any affiliation, endorsement, or partnership.
We make no representations or warranties, express or implied, regarding the accuracy, completeness, or suitability of any content or products presented. Nothing on this website should be construed as legal, tax, investment, financial, medical, or other professional advice. In addition, no part of this site—including articles or product references—constitutes a solicitation, recommendation, endorsement, advertisement, or offer to buy or sell any securities, franchises, or other financial instruments, particularly in jurisdictions where such activity would be unlawful.
All content is of a general nature and may not address the specific circumstances of any individual or entity. It is not a substitute for professional advice or services. Any actions you take based on the information provided here are strictly at your own risk. You accept full responsibility for any decisions or outcomes arising from your use of this website and agree to release us from any liability in connection with your use of, or reliance upon, the content or products found herein.