
|
Gartner, Inc. (IT): 5 FORCES Analysis [Nov-2025 Updated] |
Fully Editable: Tailor To Your Needs In Excel Or Sheets
Professional Design: Trusted, Industry-Standard Templates
Investor-Approved Valuation Models
MAC/PC Compatible, Fully Unlocked
No Expertise Is Needed; Easy To Follow
Gartner, Inc. (IT) Bundle
You're looking for a clear-eyed assessment of Gartner, Inc.'s competitive position as we map out late 2025, and honestly, the five forces framework still cuts through the noise to show where the real pressure points are for the firm projecting $6.555 billion in revenue. While their brand equity and proprietary data create a massive barrier against new entrants, you'll see intense rivalry from direct competitors like Forrester Research (doing about $400 million annually) and a growing threat from free, community-driven substitutes. The key tension, which we break down below, is whether their sticky core Research segment can keep customer power low enough to offset budget tightening on the $1,319 million Insights revenue seen in Q2 2025, especially given the high power of their own expert analysts.
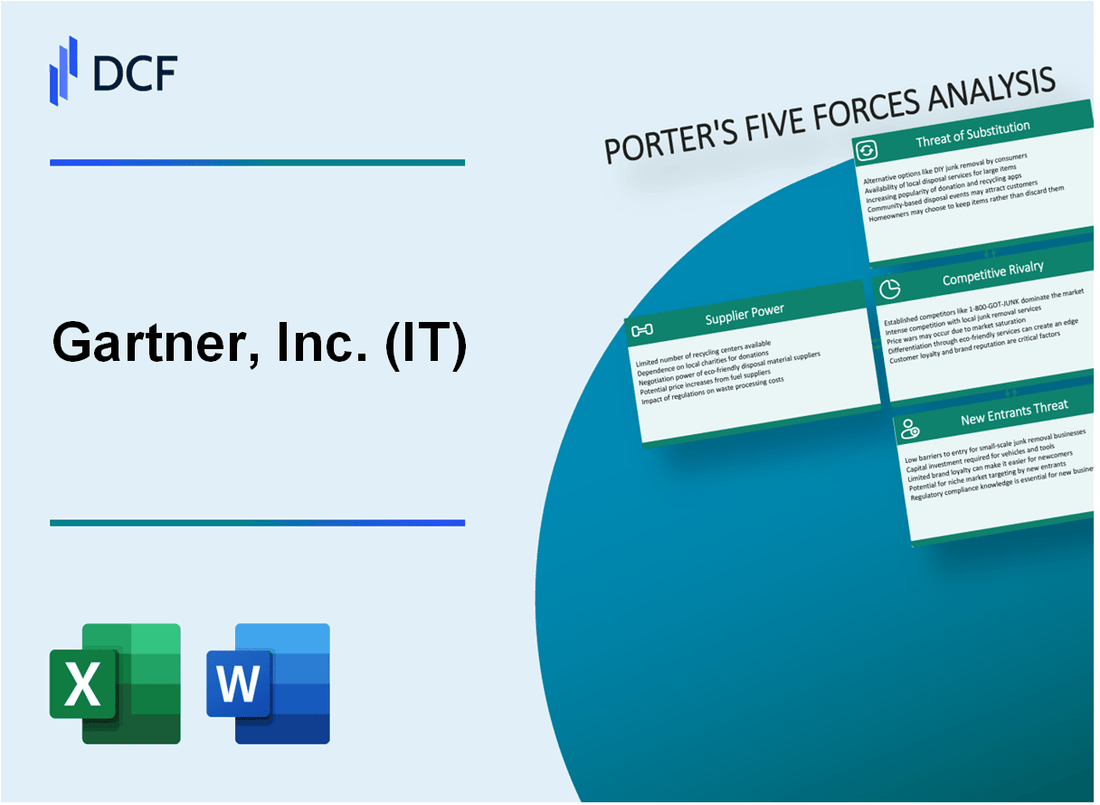
Gartner, Inc. (IT) - Porter's Five Forces: Bargaining power of suppliers
When looking at Gartner, Inc. as a supplier to its clients, we must flip the script and examine who supplies Gartner. The power held by these upstream partners is a key lever in the overall competitive structure. For Gartner, Inc., this power dynamic is complex, balancing the scarcity of human capital against the fixed costs of physical infrastructure.
High power of expert analysts due to scarcity of specialized IT talent.
You see the pressure here clearly in the labor market. Even with some tech layoffs, Gartner itself noted that the demand for tech talent still greatly outstrips supply, a situation projected to last until at least 2026. This scarcity means the experts who create the proprietary research and deliver the advisory services hold significant leverage. If Gartner cannot attract or retain top-tier analysts, the core product erodes. This dynamic forces Gartner to be highly competitive in compensation and retention strategies for its senior research staff.
- Demand for tech talent outstrips supply until at least 2026.
- Risk of losing expert talent due to retirement age.
- Potential for aggressive poaching of mid-level talent.
Low power from technology suppliers as proprietary methodology is the core resource.
Gartner, Inc.'s primary value is its intellectual property-the methodology, frameworks, and synthesized insights-not the underlying commodity technology. While they use various software and cloud providers, these are generally interchangeable inputs. The core resource is internal, meaning external technology suppliers have relatively low bargaining power because Gartner is not dependent on a single, unique technology vendor for its unique value proposition. The company is actively investing in its own AI tools, like the beta launch of AskGartner, to reduce reliance on external platforms for insight delivery.
Increased internal supplier power from the need to retain high-value C-level advisors.
This is where the power shifts internally. The C-level advisors within the Consulting and high-tier Research segments are specialized assets. The market reality, as discussed by Gartner analysts, suggests that organizations are preparing to invest heavily in competitive salaries and benefits to retain this critical skill set. For Gartner, Inc., these advisors are essential suppliers of high-value client interaction. The firm's strong recent performance-reporting an Adjusted EPS of $2.76 in Q3 2025-demonstrates the value these advisors help generate, which in turn fuels the need for higher retention spending, effectively increasing their internal bargaining power.
Dependence on event venues for Conferences segment revenue of $211 million (Q2 2025).
The physical footprint of the Conferences segment creates a distinct dependency on external suppliers, primarily event venues and logistics providers. This segment generated $211 million in revenue in Q2 2025, based on the 53 in-person destination conferences planned for the full year 2025. While the segment contribution margin was 57% in Q2 2025, venue costs are a significant, non-negotiable input. A sudden increase in venue rates or a lack of availability in key markets directly pressures the profitability of this revenue stream. If you're planning for the full year, you're looking at a substantial portion of your revenue tied to fixed, contracted physical spaces.
Here's a quick look at the financial context supporting the value being protected by these internal suppliers:
| Metric | Value (Latest Available Data) | Period/Context |
|---|---|---|
| Conferences Revenue | $211 million | Q2 2025 |
| Total Revenue | $1.5 billion | Q3 2025 |
| Adjusted EPS | $2.76 | Q3 2025 |
| Planned Destination Conferences | 53 | Full Year 2025 Guidance |
| Talent Shortage Projection | Until at least 2026 | Gartner Analyst View (Late 2025) |
The power of the venue supplier is directly proportional to the revenue generated by the physical events, which is a tangible part of the overall business, even if the Research segment is the largest component. Finance: draft 13-week cash view by Friday.
Gartner, Inc. (IT) - Porter's Five Forces: Bargaining power of customers
You're looking at the customer side of Gartner, Inc. (IT) and trying to figure out how much leverage the buyers really have. Honestly, it's a tug-of-war. The power is best described as moderate, stemming from the tension between the high cost of entry and the perceived ease of walking away, even though the core business is sticky.
The subscription costs for Gartner, Inc.'s services are definitely a lever for customers. While Gartner, Inc. does not publish standard pricing tiers, anecdotal evidence from IT managers suggests these contracts can be substantial, especially at the executive level. This high outlay naturally gives customers pause before renewal.
Here's a look at the reported expenditure levels that inform this negotiation:
| Customer Level/Scope | Reported Annual Cost Estimate | Context |
|---|---|---|
| Individual IT Manager License | Approximately $25,000 | Reported cost for a single license. |
| Senior Executive License | Around $150,000 | Reported cost for a single license for a top executive. |
| Entire IT Leadership Organization | Approximately $1.7 million | Total spend reported by one organization across its IT leadership team. |
However, this high cost is countered by the low switching costs to alternatives, which is a key factor keeping power from being high. If the perceived value drops, the path to exit seems relatively clear, though the actual migration of institutional knowledge is a hidden cost.
For the core Research segment, which was renamed Business and Technology Insights, customer power is significantly dampened by high retention. This segment is the engine, representing approximately 77% of total revenues from operations in 2024. The stickiness is real; Gartner, Inc. reported a contract renewal rate of 93% as of Q1 2025. This high rate suggests that once embedded, the service becomes mission-critical, making the decision to churn difficult for most clients.
Concentration risk among customers is low, which generally reduces their collective bargaining power. As of early 2025, Gartner, Inc. served close to 14,000 client enterprises globally, operating in approximately 90 countries and territories. This broad base means no single client represents an outsized portion of the revenue stream, preventing any one buyer from dictating terms.
Customer power definitely increases when corporate budgets tighten, putting direct pressure on the most visible revenue stream. The Insights segment generated revenues of $1,319 million in Q2 2025. This revenue is under pressure because, according to Gartner, Inc.'s own analysts, the median amount CIOs are budgeting for price increases on existing IT products and services in 2025 is 'unusually high,' signaling budget scrutiny. Furthermore, Gartner, Inc.'s own guidance for Insights revenue growth in 2025 was tempered to about 2% FX neutral growth for the full year, reflecting this cautious environment.
The threat of substitutes is a constant background pressure. Customers can easily access free, community-driven alternatives like G2.com and TrustRadius for peer reviews and initial vetting, which can reduce reliance on Gartner, Inc.'s reports for early-stage decision-making. You see this sentiment reflected in internal discussions where some users feel the service is not worth the price, suggesting they can get similar value through self-sourcing or other platforms.
- Contract Value (CV) stood at $5.0 billion in Q2 2025, up 4.9% year-over-year FX neutral.
- Subscription Insights revenue growth was expected to be about 4% for the full year 2025.
- The company repurchased 0.7 million common shares for $274 million in Q2 2025, signaling management's confidence in future cash generation despite budget pressures.
Gartner, Inc. (IT) - Porter's Five Forces: Competitive rivalry
You're assessing the competitive heat around Gartner, Inc. (IT) right now, and it's definitely intense. The rivalry with direct competitor Forrester Research shows up clearly in the financials. Forrester Research's revenue for the trailing twelve months ending September 30, 2025, was reported at $403.87M. That compares to Gartner, Inc.'s TTM revenue of $6.46B as of the same date. For the full year 2024, Forrester's annual revenue was $432.5 million, and they are guiding for 2025 revenue between $400.0 million and $415.0 million.
The competition gets much bigger when you look at the Consulting segment. Gartner, Inc. posted Consulting revenues of $558.5 million in 2024. But you're up against giants there. For instance, Deloitte Consulting's estimated revenue for FY2025 was $25.8 billion, and McKinsey & Company's estimated 2024 revenue was $18.8 billion. That's a massive scale difference in that specific service line.
Also, specialized firms chip away at specific data needs. While we don't have International Data Corporation (IDC)'s specific revenue, they are a key player in quantitative market data, like when they forecast the worldwide semiconductor market to hit $800 billion in 2025. This means Gartner, Inc. must maintain superior breadth and depth across all its research areas to keep clients from segmenting their spend.
Still, Gartner, Inc. holds a strong moat, largely due to brand equity. The ubiquity of the Magic Quadrant is a major factor here. Look at the core business: Gartner's Research segment revenue for 2024 was $5.1 billion, and its Contract Value (CV) at the end of 2024 reached $5.3 billion. That stickiness is hard to replicate. It's why Deloitte, one of those huge consulting rivals, was ranked No. 1 worldwide by revenue in consulting by Gartner itself, based on Gartner's own 2024 Market Share report.
Here's a quick look at how the revenue scales stack up in the broader competitive set for context:
| Entity | Relevant Financial Metric | Amount (Latest Available 2024/2025 Data) |
|---|---|---|
| Gartner, Inc. (IT) | Revenue (TTM ending Sep 30, 2025) | $6.46B |
| Forrester Research | Revenue (TTM ending Sep 30, 2025) | $403.87M |
| Gartner, Inc. | FY 2024 Consulting Revenue | $558.5 million |
| Deloitte Consulting | Estimated FY2025 Consulting Revenue | $25.8 billion |
| McKinsey & Company | Estimated 2024 Revenue | $18.8 billion |
The competitive pressures manifest in a few key areas you need to watch:
- Rival Forrester Research is projecting revenue declines for 2025.
- Gartner, Inc.'s Q3 2025 revenue growth was only 2.68% year-over-year.
- Consulting segment revenue growth for Gartner, Inc. in Q4 2024 was 19% year-over-year.
- Gartner's FY2024 Consulting gross contribution margin was 36%.
The brand defense is strong, but the market is clearly segmented by service size. Finance: draft 13-week cash view by Friday.
Gartner, Inc. (IT) - Porter's Five Forces: Threat of substitutes
You're looking at the competitive forces shaping Gartner, Inc. as we move through late 2025. The threat of substitutes is definitely real, but the impact varies significantly depending on the service line you are examining. Let's break down the numbers we have from the latest filings.
High threat from in-house corporate research teams and internal Centers of Excellence
The core of Gartner, Inc.'s value proposition resides in its Business and Technology Insights segment (formerly Research), which remains the profit engine. In the third quarter of 2025, this segment delivered a contribution margin of 76.7%, underscoring how critical retaining that revenue stream is to the firm's overall profitability. To combat the possibility of clients building out internal capabilities, Gartner, Inc. is aggressively using technology to boost analyst output. For instance, the amount of content published per analyst was up 31% year-over-year as of Q3 2025, and the average publishing time was reduced by 75% compared to the prior year. This efficiency drive is necessary to maintain the value proposition against internal teams who don't carry the same overhead structure.
Growing threat from free, peer-review platforms (G2.com) and open-source intelligence
The market for readily available, often free, intelligence presents a persistent headwind. While Gartner, Inc. management often cites macroeconomic pressures, the tempered full-year outlook suggests substitution pressure is present. Full-year 2025 consolidated revenue guidance was updated to at least $6.475 billion, representing only 3% FX-neutral growth, which is a deceleration from earlier projections. This is a significant defense effort to protect a client base that aids around 15,000 corporate clients. The company's ability to grow its contract value (CV) excluding the U.S. federal government was 6% in Q3 2025, which is a key metric to watch as it isolates the commercial market from specific public sector headwinds, like the federal contract value that dropped from $275 million in Q4 2024 to $225 million in Q1 2025.
Substitution risk is lower for the high-value, C-level strategic advice component
When the advice is truly strategic and targeted at mission-critical priorities for executives, the substitution risk appears lower. This is evidenced by the strong client stickiness in the core subscription business. In Q3 2025, wallet retention for Global Technology Sales was 104%, and for Global Business Sales, it was 105%. This suggests that existing clients are not only staying but are increasing their spend, which is a strong indicator that the high-level, objective insight Gartner, Inc. provides to C-level executives-especially in volatile times-is difficult to replicate with free or lower-cost alternatives. Executives are buying the promise of value realization, not just data points.
Consulting services face substitution from project-based specialists and independent contractors
The Consulting segment faces a different substitution dynamic, often competing with specialized project-based firms or independent contractors who can offer lower-cost, focused execution. The financial performance here shows more volatility than the Insights segment. For example, Consulting revenue grew 8.8% in Q2 2025, but then saw a revenue decline of 3.2% in Q3 2025. This fluctuation suggests that clients may be more willing to substitute the longer-term, integrated advice of Gartner, Inc. Consulting for more agile, on-demand external specialists for specific projects, or perhaps delaying those engagements entirely.
| Metric | Value (Latest Available 2025 Data) | Segment/Context |
|---|---|---|
| FY 2025 Consolidated Revenue Guidance (Updated) | At least $6.475 billion | Full Year 2025 Outlook |
| Insights Segment Contribution Margin | 76.7% | Q3 2025 Profitability Driver |
| Analyst Content Published YoY Growth | Up 31% | Q3 2025 Efficiency Against In-House Threat |
| Analyst Publishing Time Reduction YoY | 75% | Q3 2025 Efficiency Against In-House Threat |
| Wallet Retention (GBS) | 105% | Q3 2025 C-Level Value Indicator |
| Consulting Revenue Growth | -3.2% | Q3 2025 (Decline vs. Q2 Growth) |
| U.S. Federal Contract Value (Q1 2025) | $225 million | Context for Substitution Risk in Public Sector |
The company is definitely pushing its AI capabilities, like the rollout of AskGartner, to ensure its proprietary insights remain superior to what's freely available. Finance: draft 13-week cash view by Friday.
Gartner, Inc. (IT) - Porter's Five Forces: Threat of new entrants
You're looking at the barriers to entry for a new firm trying to replicate Gartner, Inc.'s position. Honestly, the hurdles are substantial, largely built on years of relationship capital and data accumulation.
Low threat due to massive capital required to build an equivalent global analyst network. To even approach Gartner, Inc.'s scale, a new entrant needs capital to hire, train, and deploy a global team capable of covering the breadth of technology and business topics they cover. Consider the sheer size of the established operation. Gartner, Inc. projected consolidated revenue of at least $6.555 billion for fiscal year 2025, and the company holds a market capitalization around $18 Billion as of late 2025. Replicating this requires massive, sustained investment before any meaningful revenue can be generated.
Here's a quick look at the scale difference a new entrant faces:
| Metric | Gartner, Inc. (Approx. Late 2025) | Hypothetical New Entrant (Initial Target) |
|---|---|---|
| Projected 2025 Revenue | $6.555 billion | $0 (Pre-revenue) |
| Approximate Market Capitalization | $18 Billion | Seed/Series A Funding Target |
| Corporate Clients Served | ~15,000 | 0 |
| Analyst Coverage Scope | 87 Magic Quadrants | 1-3 Niche Areas |
High barrier from strong brand equity and the proprietary data moat. Gartner, Inc.'s brand recognition, cemented by tools like the Magic Quadrant, which covers 87 technology markets, acts as a significant deterrent. Furthermore, the value of proprietary data creates a deep moat. Companies leveraging exclusive datasets report average customer acquisition costs 60% lower than industry averages and customer lifetime values that increase by 280% due to superior personalization based on exclusive behavioral insights. A new entrant must spend years building this feedback loop of data collection and insight refinement.
New entrants struggle to replicate the scale needed to generate $6.555 billion in projected 2025 revenue. The existing client base of approximately 15,000 corporate clients provides a continuous stream of interaction data and direct access for analysts, which is the lifeblood of the research process. This scale creates a positive feedback loop that is nearly impossible to jumpstart.
AI-powered tools like AskGartner increase the technological barrier to entry. While general-purpose AI can lower some technical barriers in other fields, the frontier of high-value research still requires massive, specialized data sets. Exponentially growing AI model training costs create a market entry barrier, favoring established firms with the financial capacity to cover these fixed costs. Gartner's investment in tools like AskGartner leverages their existing proprietary data, meaning a competitor must not only build an analyst network but also replicate the underlying, expensive, proprietary data foundation that fuels their AI capabilities.
Key barriers to entry include:
- Massive initial capital outlay required.
- Years needed for data accumulation at scale.
- Strong, established brand equity/trust.
- High fixed costs for frontier AI training.
Finance: review the capital expenditure model for a three-year analyst hiring plan by next Wednesday.
Disclaimer
All information, articles, and product details provided on this website are for general informational and educational purposes only. We do not claim any ownership over, nor do we intend to infringe upon, any trademarks, copyrights, logos, brand names, or other intellectual property mentioned or depicted on this site. Such intellectual property remains the property of its respective owners, and any references here are made solely for identification or informational purposes, without implying any affiliation, endorsement, or partnership.
We make no representations or warranties, express or implied, regarding the accuracy, completeness, or suitability of any content or products presented. Nothing on this website should be construed as legal, tax, investment, financial, medical, or other professional advice. In addition, no part of this site—including articles or product references—constitutes a solicitation, recommendation, endorsement, advertisement, or offer to buy or sell any securities, franchises, or other financial instruments, particularly in jurisdictions where such activity would be unlawful.
All content is of a general nature and may not address the specific circumstances of any individual or entity. It is not a substitute for professional advice or services. Any actions you take based on the information provided here are strictly at your own risk. You accept full responsibility for any decisions or outcomes arising from your use of this website and agree to release us from any liability in connection with your use of, or reliance upon, the content or products found herein.