
|
Jai Corp Limited (JAICORPLTD.NS) DCF Valuation |
Fully Editable: Tailor To Your Needs In Excel Or Sheets
Professional Design: Trusted, Industry-Standard Templates
Investor-Approved Valuation Models
MAC/PC Compatible, Fully Unlocked
No Expertise Is Needed; Easy To Follow
Jai Corp Limited (JAICORPLTD.NS) Bundle
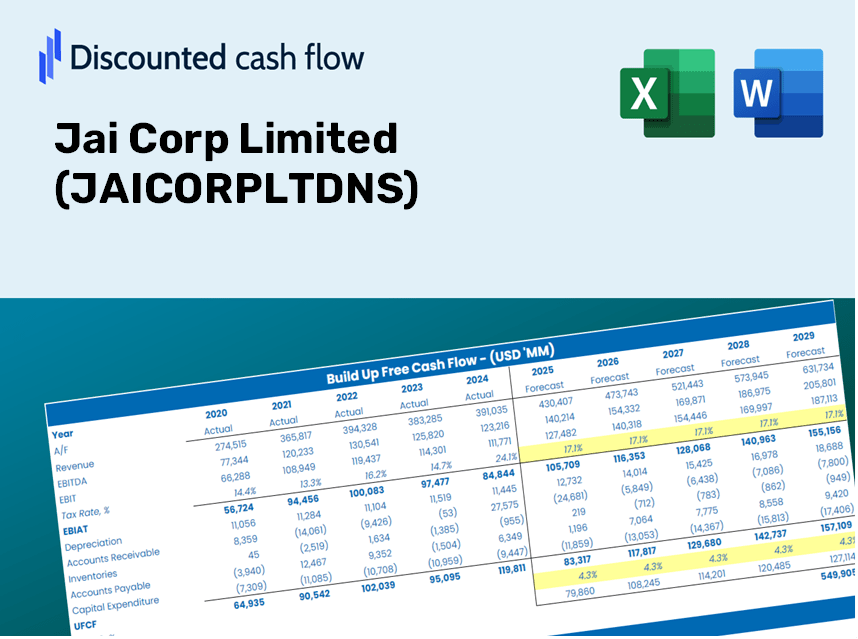
Enhance your valuation analysis of Jai Corp Limited (JAICORPLTDNS) with our sophisticated DCF Calculator! This Excel template comes preloaded with real data for (JAICORPLTDNS), enabling you to adjust forecasts and assumptions to accurately determine the intrinsic value of Jai Corp Limited.
Discounted Cash Flow (DCF) - (USD MM)
| Year | AY1 2021 |
AY2 2022 |
AY3 2023 |
AY4 2024 |
AY5 2025 |
FY1 2026 |
FY2 2027 |
FY3 2028 |
FY4 2029 |
FY5 2030 |
|---|---|---|---|---|---|---|---|---|---|---|
| Revenue | 4,715.1 | 7,200.9 | 5,943.3 | 4,814.6 | 5,177.0 | 5,484.9 | 5,811.2 | 6,156.8 | 6,523.0 | 6,911.0 |
| Revenue Growth, % | 0 | 52.72 | -17.46 | -18.99 | 7.53 | 5.95 | 5.95 | 5.95 | 5.95 | 5.95 |
| EBITDA | 1,570.6 | 812.3 | 265.5 | 861.0 | 942.7 | 934.1 | 989.6 | 1,048.5 | 1,110.9 | 1,176.9 |
| EBITDA, % | 33.31 | 11.28 | 4.47 | 17.88 | 18.21 | 17.03 | 17.03 | 17.03 | 17.03 | 17.03 |
| Depreciation | 139.6 | 130.5 | 128.8 | 122.9 | 112.9 | 128.1 | 135.7 | 143.7 | 152.3 | 161.4 |
| Depreciation, % | 2.96 | 1.81 | 2.17 | 2.55 | 2.18 | 2.33 | 2.33 | 2.33 | 2.33 | 2.33 |
| EBIT | 1,431.1 | 681.8 | 136.7 | 738.1 | 829.8 | 806.0 | 854.0 | 904.8 | 958.6 | 1,015.6 |
| EBIT, % | 30.35 | 9.47 | 2.3 | 15.33 | 16.03 | 14.7 | 14.7 | 14.7 | 14.7 | 14.7 |
| Total Cash | 543.5 | 736.7 | 1,825.7 | 2,374.0 | 1,722.3 | 1,481.5 | 1,569.6 | 1,663.0 | 1,761.9 | 1,866.7 |
| Total Cash, percent | .0 | .0 | .0 | .0 | .0 | .0 | .0 | .0 | .0 | .0 |
| Account Receivables | 1,169.6 | 893.3 | 854.3 | 721.8 | 770.4 | 893.6 | 946.7 | 1,003.0 | 1,062.7 | 1,125.9 |
| Account Receivables, % | 24.81 | 12.41 | 14.37 | 14.99 | 14.88 | 16.29 | 16.29 | 16.29 | 16.29 | 16.29 |
| Inventories | 2,463.8 | 2,280.0 | 2,109.9 | 2,146.4 | 2,064.4 | 2,236.5 | 2,369.5 | 2,510.4 | 2,659.7 | 2,817.9 |
| Inventories, % | 52.25 | 31.66 | 35.5 | 44.58 | 39.88 | 40.77 | 40.77 | 40.77 | 40.77 | 40.77 |
| Accounts Payable | 46.5 | 72.2 | 45.8 | 67.0 | 25.0 | 50.8 | 53.8 | 57.0 | 60.4 | 64.0 |
| Accounts Payable, % | 0.98626 | 1 | 0.76998 | 1.39 | 0.48291 | 0.92655 | 0.92655 | 0.92655 | 0.92655 | 0.92655 |
| Capital Expenditure | -85.6 | -36.2 | -42.3 | -16.7 | -28.0 | -43.0 | -45.5 | -48.2 | -51.1 | -54.1 |
| Capital Expenditure, % | -1.81 | -0.50233 | -0.71173 | -0.34765 | -0.54085 | -0.78346 | -0.78346 | -0.78346 | -0.78346 | -0.78346 |
| Tax Rate, % | 19.8 | 19.8 | 19.8 | 19.8 | 19.8 | 19.8 | 19.8 | 19.8 | 19.8 | 19.8 |
| EBITAT | 1,039.2 | 553.7 | -385.7 | 539.0 | 665.5 | 495.0 | 524.5 | 555.6 | 588.7 | 623.7 |
| Depreciation | ||||||||||
| Changes in Account Receivables | ||||||||||
| Changes in Inventories | ||||||||||
| Changes in Accounts Payable | ||||||||||
| Capital Expenditure | ||||||||||
| UFCF | -2,493.7 | 1,133.8 | -116.5 | 762.4 | 741.8 | 310.7 | 431.5 | 457.1 | 484.3 | 513.1 |
| WACC, % | 4.68 | 4.68 | 4.68 | 4.68 | 4.68 | 4.68 | 4.68 | 4.68 | 4.68 | 4.68 |
| PV UFCF | ||||||||||
| SUM PV UFCF | 1,900.4 | |||||||||
| Long Term Growth Rate, % | 4.00 | |||||||||
| Free cash flow (T + 1) | 534 | |||||||||
| Terminal Value | 78,017 | |||||||||
| Present Terminal Value | 62,057 | |||||||||
| Enterprise Value | 63,957 | |||||||||
| Net Debt | -98 | |||||||||
| Equity Value | 64,055 | |||||||||
| Diluted Shares Outstanding, MM | 177 | |||||||||
| Equity Value Per Share | 361.89 |
What You Will Receive
- Authentic JAICORPLTDNS Financials: Access to both historical and projected data for precise valuation.
- Customizable Inputs: Adjust parameters such as WACC, tax rates, revenue growth, and capital expenditures as needed.
- Real-Time Calculations: Dynamic calculations for intrinsic value and NPV.
- Scenario Analysis: Explore various scenarios to assess the future performance of Jai Corp Limited.
- User-Friendly and Intuitive Design: Designed for professionals while remaining accessible to newcomers.
Key Features
- Customizable Forecast Parameters: Adjust essential inputs such as revenue growth, EBITDA percentage, and capital expenditures.
- Instant DCF Valuation: Effortlessly computes intrinsic value, NPV, and other financial metrics.
- High-Precision Accuracy: Leverages Jai Corp Limited's (JAICORPLTDNS) real-world financial data for realistic valuation results.
- Simplified Scenario Analysis: Easily evaluate different assumptions and compare various outcomes.
- Efficiency Booster: Remove the hassle of constructing complex valuation models from the ground up.
How It Works
- 1. Download the Template: Access and open the Excel file that includes Jai Corp Limited’s (JAICORPLTDNS) preloaded data.
- 2. Modify Assumptions: Adjust critical inputs such as growth projections, WACC, and capital expenditure figures.
- 3. Instantly View Results: The DCF model automatically calculates the intrinsic value and NPV based on your inputs.
- 4. Explore Scenarios: Analyze various forecasts to evaluate different valuation possibilities.
- 5. Present with Confidence: Share comprehensive valuation insights to reinforce your strategic decisions.
Why Opt for This Calculator?
- Precise Data: Authentic Jai Corp Limited (JAICORPLTDNS) financials provide trustworthy valuation outcomes.
- Tailorable: Modify essential metrics such as growth rates, WACC, and tax rates to align with your forecasts.
- Efficiency Boost: Built-in calculations save you from starting from square one.
- Expert-Level Tool: Crafted for investors, analysts, and consultants alike.
- Easy to Use: User-friendly design and step-by-step guidance ensure accessibility for everyone.
Who Can Benefit from Jai Corp Limited (JAICORPLTDNS)?
- Investors: Equip yourself with a robust valuation tool to make informed investment choices.
- Financial Analysts: Streamline your processes with an easily customizable DCF model at your fingertips.
- Consultants: Effortlessly modify the template for impactful client presentations or comprehensive reports.
- Finance Enthusiasts: Enhance your grasp of valuation methods through practical, real-world case studies.
- Educators and Students: Leverage this tool as an effective resource for finance education and training.
What the Template Includes
- Pre-Filled DCF Model: Jai Corp Limited's (JAICORPLTDNS) financial data preloaded for quick access.
- WACC Calculator: Comprehensive calculations for the Weighted Average Cost of Capital.
- Financial Ratios: Assess Jai Corp Limited's profitability, leverage, and operational efficiency.
- Editable Inputs: Modify assumptions such as growth rates, profit margins, and capital expenditures to align with your analysis.
- Financial Statements: Access annual and quarterly reports to facilitate in-depth evaluation.
- Interactive Dashboard: Effortlessly visualize essential valuation metrics and outcomes.
Disclaimer
All information, articles, and product details provided on this website are for general informational and educational purposes only. We do not claim any ownership over, nor do we intend to infringe upon, any trademarks, copyrights, logos, brand names, or other intellectual property mentioned or depicted on this site. Such intellectual property remains the property of its respective owners, and any references here are made solely for identification or informational purposes, without implying any affiliation, endorsement, or partnership.
We make no representations or warranties, express or implied, regarding the accuracy, completeness, or suitability of any content or products presented. Nothing on this website should be construed as legal, tax, investment, financial, medical, or other professional advice. In addition, no part of this site—including articles or product references—constitutes a solicitation, recommendation, endorsement, advertisement, or offer to buy or sell any securities, franchises, or other financial instruments, particularly in jurisdictions where such activity would be unlawful.
All content is of a general nature and may not address the specific circumstances of any individual or entity. It is not a substitute for professional advice or services. Any actions you take based on the information provided here are strictly at your own risk. You accept full responsibility for any decisions or outcomes arising from your use of this website and agree to release us from any liability in connection with your use of, or reliance upon, the content or products found herein.