
|
Janus Henderson Group plc (JHG) DCF Valuation |
Fully Editable: Tailor To Your Needs In Excel Or Sheets
Professional Design: Trusted, Industry-Standard Templates
Investor-Approved Valuation Models
MAC/PC Compatible, Fully Unlocked
No Expertise Is Needed; Easy To Follow
Janus Henderson Group plc (JHG) Bundle
Discover the true value of Janus Henderson Group plc (JHG) with our advanced DCF Calculator! Adjust key assumptions, explore various scenarios, and assess the effects of changes on Janus Henderson's valuation – all within a single Excel template.
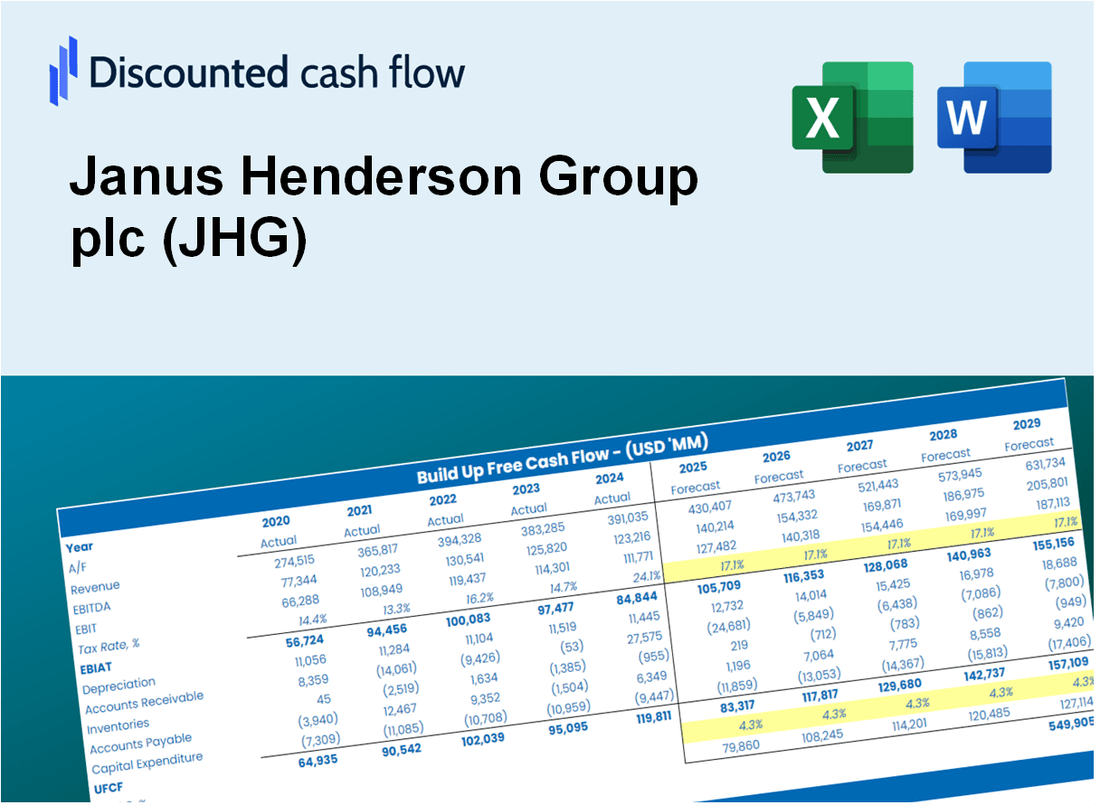
Discounted Cash Flow (DCF) - (USD MM)
| Year | AY1 2020 |
AY2 2021 |
AY3 2022 |
AY4 2023 |
AY5 2024 |
FY1 2025 |
FY2 2026 |
FY3 2027 |
FY4 2028 |
FY5 2029 |
|---|---|---|---|---|---|---|---|---|---|---|
| Revenue | 2,298.6 | 2,767.0 | 2,203.6 | 2,101.8 | 2,473.2 | 2,554.0 | 2,637.4 | 2,723.6 | 2,812.6 | 2,904.4 |
| Revenue Growth, % | 0 | 20.38 | -20.36 | -4.62 | 17.67 | 3.27 | 3.27 | 3.27 | 3.27 | 3.27 |
| EBITDA | 265.6 | 871.2 | 419.7 | 562.6 | 654.4 | 589.0 | 608.3 | 628.1 | 648.7 | 669.8 |
| EBITDA, % | 11.55 | 31.49 | 19.05 | 26.77 | 26.46 | 23.06 | 23.06 | 23.06 | 23.06 | 23.06 |
| Depreciation | 49.2 | 40.7 | 31.7 | 22.9 | 24.5 | 36.4 | 37.6 | 38.8 | 40.1 | 41.4 |
| Depreciation, % | 2.14 | 1.47 | 1.44 | 1.09 | 0.99062 | 1.43 | 1.43 | 1.43 | 1.43 | 1.43 |
| EBIT | 216.4 | 830.5 | 388.0 | 539.7 | 629.9 | 552.6 | 570.7 | 589.3 | 608.5 | 628.4 |
| EBIT, % | 9.41 | 30.01 | 17.61 | 25.68 | 25.47 | 21.64 | 21.64 | 21.64 | 21.64 | 21.64 |
| Total Cash | 1,590.8 | 1,820.9 | 1,772.3 | 1,884.7 | 2,074.0 | 1,986.9 | 2,051.8 | 2,118.8 | 2,188.0 | 2,259.5 |
| Total Cash, percent | .0 | .0 | .0 | .0 | .0 | .0 | .0 | .0 | .0 | .0 |
| Account Receivables | 490.4 | 446.9 | 349.7 | 415.1 | 432.7 | 462.8 | 477.9 | 493.5 | 509.6 | 526.3 |
| Account Receivables, % | 21.33 | 16.15 | 15.87 | 19.75 | 17.5 | 18.12 | 18.12 | 18.12 | 18.12 | 18.12 |
| Inventories | .0 | .0 | .0 | .0 | .0 | .0 | .0 | .0 | .0 | .0 |
| Inventories, % | 0 | 0 | 0 | 0 | 0 | 0 | 0 | 0 | 0 | 0 |
| Accounts Payable | 3.2 | 2.6 | 4.3 | 3.2 | 4.7 | 3.9 | 4.1 | 4.2 | 4.3 | 4.5 |
| Accounts Payable, % | 0.13922 | 0.09396458 | 0.19514 | 0.15225 | 0.19004 | 0.15412 | 0.15412 | 0.15412 | 0.15412 | 0.15412 |
| Capital Expenditure | -17.8 | -10.4 | -17.6 | -10.8 | -10.1 | -14.7 | -15.1 | -15.6 | -16.2 | -16.7 |
| Capital Expenditure, % | -0.77438 | -0.37586 | -0.79869 | -0.51385 | -0.40838 | -0.57423 | -0.57423 | -0.57423 | -0.57423 | -0.57423 |
| Tax Rate, % | 33.18 | 33.18 | 33.18 | 33.18 | 33.18 | 33.18 | 33.18 | 33.18 | 33.18 | 33.18 |
| EBITAT | 138.6 | 629.7 | 384.9 | 401.4 | 420.9 | 420.3 | 434.0 | 448.2 | 462.8 | 477.9 |
| Depreciation | ||||||||||
| Changes in Account Receivables | ||||||||||
| Changes in Inventories | ||||||||||
| Changes in Accounts Payable | ||||||||||
| Capital Expenditure | ||||||||||
| UFCF | -317.2 | 702.9 | 497.9 | 347.0 | 419.2 | 411.2 | 441.5 | 455.9 | 470.8 | 486.2 |
| WACC, % | 10.53 | 10.56 | 10.62 | 10.56 | 10.54 | 10.56 | 10.56 | 10.56 | 10.56 | 10.56 |
| PV UFCF | ||||||||||
| SUM PV UFCF | 1,679.8 | |||||||||
| Long Term Growth Rate, % | 2.00 | |||||||||
| Free cash flow (T + 1) | 496 | |||||||||
| Terminal Value | 5,793 | |||||||||
| Present Terminal Value | 3,507 | |||||||||
| Enterprise Value | 5,186 | |||||||||
| Net Debt | -748 | |||||||||
| Equity Value | 5,935 | |||||||||
| Diluted Shares Outstanding, MM | 156 | |||||||||
| Equity Value Per Share | 38.09 |
What You Will Receive
- Authentic JHG Financial Data: Pre-loaded with Janus Henderson’s historical and projected figures for accurate analysis.
- Completely Customizable Template: Easily adjust key parameters such as revenue growth, WACC, and EBITDA %.
- Instantaneous Calculations: Watch JHG’s intrinsic value update in real-time as you make adjustments.
- Expert Valuation Tool: Tailored for investors, analysts, and consultants aiming for precise DCF outcomes.
- Intuitive Design: User-friendly layout and straightforward instructions suitable for all skill levels.
Key Features
- Comprehensive JHG Data: Pre-loaded with Janus Henderson Group plc's historical financial metrics and future projections.
- Fully Customizable Inputs: Modify growth rates, profit margins, discount rates, tax assumptions, and capital investments.
- Dynamic Valuation Framework: Instantaneous updates to Net Present Value (NPV) and intrinsic value based on your specified parameters.
- Scenario Analysis: Develop various forecasting scenarios to evaluate different valuation results.
- User-Friendly Interface: Intuitive, organized, and suitable for both experts and novices.
How It Works
- Download: Get the pre-built Excel file containing Janus Henderson Group plc's (JHG) financial data.
- Customize: Modify key metrics such as revenue growth, EBITDA %, and WACC to fit your analysis.
- Update Automatically: Watch as the intrinsic value and NPV calculations refresh in real-time.
- Test Scenarios: Develop various forecasts and instantly compare the results.
- Make Decisions: Leverage the valuation findings to inform your investment choices.
Why Choose This Calculator for Janus Henderson Group plc (JHG)?
- Precise Information: Utilize real Janus Henderson financials for trustworthy valuation outcomes.
- Flexible Options: Tailor essential variables such as growth rates, WACC, and tax rates to align with your forecasts.
- Efficiency Boost: Built-in calculations save you the hassle of starting from the ground up.
- Expert-Level Tool: Crafted for investors, analysts, and financial consultants.
- Easy to Navigate: User-friendly design and clear, step-by-step guidance cater to all experience levels.
Who Should Use This Product?
- Individual Investors: Gain insights to make informed decisions regarding buying or selling Janus Henderson Group plc (JHG) stock.
- Financial Analysts: Enhance valuation processes with comprehensive and ready-to-use financial models for Janus Henderson Group plc (JHG).
- Consultants: Provide clients with professional valuation insights on Janus Henderson Group plc (JHG) efficiently and accurately.
- Business Owners: Learn how large asset management firms like Janus Henderson Group plc (JHG) are valued to inform your own business strategies.
- Finance Students: Explore valuation techniques through real-world data and case studies involving Janus Henderson Group plc (JHG).
What the Template Contains
- Operating and Balance Sheet Data: Pre-filled Janus Henderson Group plc (JHG) historical data and forecasts, including revenue, EBITDA, EBIT, and capital expenditures.
- WACC Calculation: A dedicated sheet for Weighted Average Cost of Capital (WACC), including parameters like Beta, risk-free rate, and share price.
- DCF Valuation (Unlevered and Levered): Editable Discounted Cash Flow models showing intrinsic value with detailed calculations.
- Financial Statements: Pre-loaded financial statements (annual and quarterly) to support analysis.
- Key Ratios: Includes profitability, leverage, and efficiency ratios for Janus Henderson Group plc (JHG).
- Dashboard and Charts: Visual summary of valuation outputs and assumptions to analyze results easily.
Disclaimer
All information, articles, and product details provided on this website are for general informational and educational purposes only. We do not claim any ownership over, nor do we intend to infringe upon, any trademarks, copyrights, logos, brand names, or other intellectual property mentioned or depicted on this site. Such intellectual property remains the property of its respective owners, and any references here are made solely for identification or informational purposes, without implying any affiliation, endorsement, or partnership.
We make no representations or warranties, express or implied, regarding the accuracy, completeness, or suitability of any content or products presented. Nothing on this website should be construed as legal, tax, investment, financial, medical, or other professional advice. In addition, no part of this site—including articles or product references—constitutes a solicitation, recommendation, endorsement, advertisement, or offer to buy or sell any securities, franchises, or other financial instruments, particularly in jurisdictions where such activity would be unlawful.
All content is of a general nature and may not address the specific circumstances of any individual or entity. It is not a substitute for professional advice or services. Any actions you take based on the information provided here are strictly at your own risk. You accept full responsibility for any decisions or outcomes arising from your use of this website and agree to release us from any liability in connection with your use of, or reliance upon, the content or products found herein.