
|
JPMorgan Chase & Co. (JPM) DCF Valuation |
Fully Editable: Tailor To Your Needs In Excel Or Sheets
Professional Design: Trusted, Industry-Standard Templates
Investor-Approved Valuation Models
MAC/PC Compatible, Fully Unlocked
No Expertise Is Needed; Easy To Follow
JPMorgan Chase & Co. (JPM) Bundle
Discover the true potential of JPMorgan Chase & Co. (JPM) with our advanced DCF Calculator! Adjust critical assumptions, explore various scenarios, and evaluate how changes affect JPMorgan Chase & Co. (JPM) valuation – all within one comprehensive Excel template.
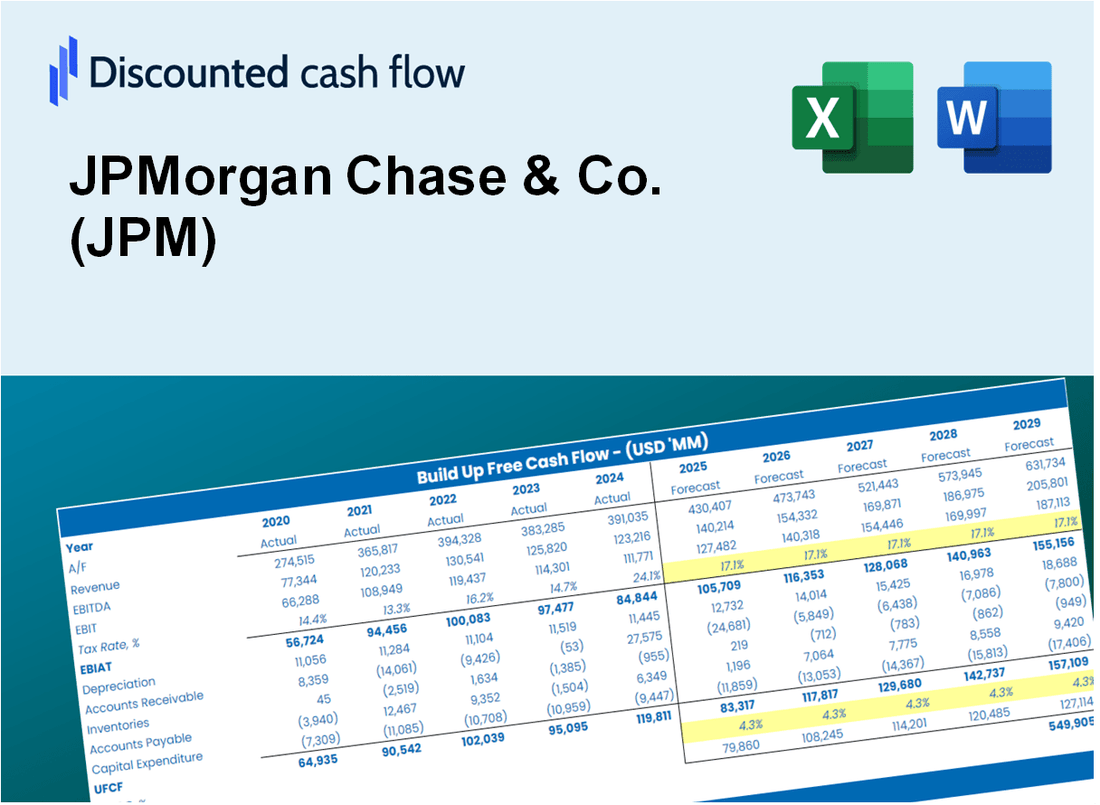
Discounted Cash Flow (DCF) - (USD MM)
| Year | AY1 2020 |
AY2 2021 |
AY3 2022 |
AY4 2023 |
AY5 2024 |
FY1 2025 |
FY2 2026 |
FY3 2027 |
FY4 2028 |
FY5 2029 |
|---|---|---|---|---|---|---|---|---|---|---|
| Revenue | 129,843.0 | 127,238.0 | 153,824.0 | 236,273.0 | 278,906.0 | 342,030.8 | 419,442.6 | 514,374.9 | 630,793.4 | 773,560.8 |
| Revenue Growth, % | 0 | -2.01 | 20.89 | 53.6 | 18.04 | 22.63 | 22.63 | 22.63 | 22.63 | 22.63 |
| EBITDA | 44,429.0 | 67,494.0 | 53,217.0 | 69,124.0 | 83,019.0 | 123,733.7 | 151,738.3 | 186,081.2 | 228,197.0 | 279,844.8 |
| EBITDA, % | 34.22 | 53.05 | 34.6 | 29.26 | 29.77 | 36.18 | 36.18 | 36.18 | 36.18 | 36.18 |
| Depreciation | 8,614.0 | 7,932.0 | 7,051.0 | 7,512.0 | 7,938.0 | 16,060.0 | 19,694.9 | 24,152.4 | 29,618.8 | 36,322.5 |
| Depreciation, % | 6.63 | 6.23 | 4.58 | 3.18 | 2.85 | 4.7 | 4.7 | 4.7 | 4.7 | 4.7 |
| EBIT | 35,815.0 | 59,562.0 | 46,166.0 | 61,612.0 | 75,081.0 | 107,673.7 | 132,043.4 | 161,928.8 | 198,578.1 | 243,522.3 |
| EBIT, % | 27.58 | 46.81 | 30.01 | 26.08 | 26.92 | 31.48 | 31.48 | 31.48 | 31.48 | 31.48 |
| Total Cash | 883,560.0 | 1,031,091.0 | 763,933.0 | 816,636.0 | 866,007.0 | 342,030.8 | 419,442.6 | 514,374.9 | 630,793.4 | 773,560.8 |
| Total Cash, percent | .0 | .0 | .0 | .0 | .0 | .0 | .0 | .0 | .0 | .0 |
| Account Receivables | 90,503.0 | 102,570.0 | 125,189.0 | 107,363.0 | 101,223.0 | 214,406.9 | 262,933.7 | 322,443.4 | 395,422.0 | 484,917.8 |
| Account Receivables, % | 69.7 | 80.61 | 81.38 | 45.44 | 36.29 | 62.69 | 62.69 | 62.69 | 62.69 | 62.69 |
| Inventories | .0 | .0 | .0 | .0 | .0 | .0 | .0 | .0 | .0 | .0 |
| Inventories, % | 0 | 0 | 0 | 0 | 0 | 0 | 0 | 0 | 0 | 0 |
| Accounts Payable | 140,291.0 | 169,172.0 | 188,692.0 | 161,960.0 | 153,153.0 | 289,672.6 | 355,234.2 | 435,634.3 | 534,231.4 | 655,143.9 |
| Accounts Payable, % | 108.05 | 132.96 | 122.67 | 68.55 | 54.91 | 84.69 | 84.69 | 84.69 | 84.69 | 84.69 |
| Capital Expenditure | .0 | .0 | .0 | .0 | .0 | .0 | .0 | .0 | .0 | .0 |
| Capital Expenditure, % | 0 | 0 | 0 | 0 | 0 | 0 | 0 | 0 | 0 | 0 |
| Tax Rate, % | 22.12 | 22.12 | 22.12 | 22.12 | 22.12 | 22.12 | 22.12 | 22.12 | 22.12 | 22.12 |
| EBITAT | 29,131.0 | 48,334.0 | 37,676.0 | 49,552.0 | 58,471.0 | 86,655.6 | 106,268.4 | 130,320.1 | 159,815.4 | 195,986.5 |
| Depreciation | ||||||||||
| Changes in Account Receivables | ||||||||||
| Changes in Inventories | ||||||||||
| Changes in Accounts Payable | ||||||||||
| Capital Expenditure | ||||||||||
| UFCF | 87,533.0 | 73,080.0 | 41,628.0 | 48,158.0 | 63,742.0 | 126,051.3 | 142,998.2 | 175,362.9 | 215,052.8 | 263,725.7 |
| WACC, % | 9.92 | 9.91 | 9.93 | 9.86 | 9.7 | 9.86 | 9.86 | 9.86 | 9.86 | 9.86 |
| PV UFCF | ||||||||||
| SUM PV UFCF | 677,833.5 | |||||||||
| Long Term Growth Rate, % | 2.00 | |||||||||
| Free cash flow (T + 1) | 269,000 | |||||||||
| Terminal Value | 3,420,705 | |||||||||
| Present Terminal Value | 2,137,179 | |||||||||
| Enterprise Value | 2,815,012 | |||||||||
| Net Debt | 281,829 | |||||||||
| Equity Value | 2,533,183 | |||||||||
| Diluted Shares Outstanding, MM | 2,879 | |||||||||
| Equity Value Per Share | 879.88 |
What You Will Get
- Real JPMorgan Chase Data: Preloaded financials – from revenue to EBIT – based on actual and projected figures.
- Full Customization: Adjust all critical parameters (yellow cells) like WACC, growth %, and tax rates.
- Instant Valuation Updates: Automatic recalculations to analyze the impact of changes on JPMorgan Chase's fair value.
- Versatile Excel Template: Tailored for quick edits, scenario testing, and detailed projections.
- Time-Saving and Accurate: Skip building models from scratch while maintaining precision and flexibility.
Key Features
- Comprehensive DCF Calculator: Offers detailed unlevered and levered DCF valuation models tailored for JPMorgan Chase & Co. (JPM).
- WACC Calculator: Features a pre-built Weighted Average Cost of Capital sheet with adjustable inputs specific to JPM.
- Customizable Forecast Assumptions: Easily modify growth rates, capital expenditures, and discount rates to fit JPM's financial outlook.
- Integrated Financial Ratios: Evaluate profitability, leverage, and efficiency ratios specifically for JPMorgan Chase & Co. (JPM).
- Interactive Dashboard and Charts: Visual representations that summarize essential valuation metrics for straightforward analysis.
How It Works
- Step 1: Download the Excel file.
- Step 2: Review JPMorgan Chase & Co.’s (JPM) pre-filled financial data and forecasts.
- Step 3: Modify key inputs such as revenue growth, WACC, and tax rates (highlighted cells).
- Step 4: Observe the DCF model update in real-time as you adjust your assumptions.
- Step 5: Analyze the outputs and leverage the results for your investment decisions.
Why Choose This Calculator for JPMorgan Chase & Co. (JPM)?
- Accuracy: Leverage real JPMorgan financial data for precise calculations.
- Flexibility: Tailored for users to easily adjust and test various inputs.
- Time-Saving: Eliminate the need to construct a DCF model from the ground up.
- Professional-Grade: Crafted with the expertise and usability expected at a CFO level.
- User-Friendly: Intuitive design makes it accessible for users without extensive financial modeling knowledge.
Who Should Use This Product?
- Institutional Investors: Develop comprehensive and accurate valuation models for assessing JPMorgan Chase & Co. (JPM) investment opportunities.
- Corporate Finance Departments: Evaluate financial scenarios to inform strategic decision-making within their organizations.
- Financial Consultants: Deliver precise valuation analyses and insights regarding JPMorgan Chase & Co. (JPM) to clients.
- Academic Scholars and Students: Leverage real-time data to enhance learning and teaching in financial modeling courses.
- Finance Enthusiasts: Gain insights into how major banking institutions like JPMorgan Chase & Co. (JPM) are valued in the financial markets.
What the Template Contains
- Preloaded JPM Data: Historical and projected financial data, including revenue, EBIT, and capital expenditures.
- DCF and WACC Models: Professional-grade sheets for calculating intrinsic value and Weighted Average Cost of Capital.
- Editable Inputs: Yellow-highlighted cells for adjusting revenue growth, tax rates, and discount rates.
- Financial Statements: Comprehensive annual and quarterly financials for deeper analysis.
- Key Ratios: Profitability, leverage, and efficiency ratios to evaluate performance.
- Dashboard and Charts: Visual summaries of valuation outcomes and assumptions.
Disclaimer
All information, articles, and product details provided on this website are for general informational and educational purposes only. We do not claim any ownership over, nor do we intend to infringe upon, any trademarks, copyrights, logos, brand names, or other intellectual property mentioned or depicted on this site. Such intellectual property remains the property of its respective owners, and any references here are made solely for identification or informational purposes, without implying any affiliation, endorsement, or partnership.
We make no representations or warranties, express or implied, regarding the accuracy, completeness, or suitability of any content or products presented. Nothing on this website should be construed as legal, tax, investment, financial, medical, or other professional advice. In addition, no part of this site—including articles or product references—constitutes a solicitation, recommendation, endorsement, advertisement, or offer to buy or sell any securities, franchises, or other financial instruments, particularly in jurisdictions where such activity would be unlawful.
All content is of a general nature and may not address the specific circumstances of any individual or entity. It is not a substitute for professional advice or services. Any actions you take based on the information provided here are strictly at your own risk. You accept full responsibility for any decisions or outcomes arising from your use of this website and agree to release us from any liability in connection with your use of, or reliance upon, the content or products found herein.