
|
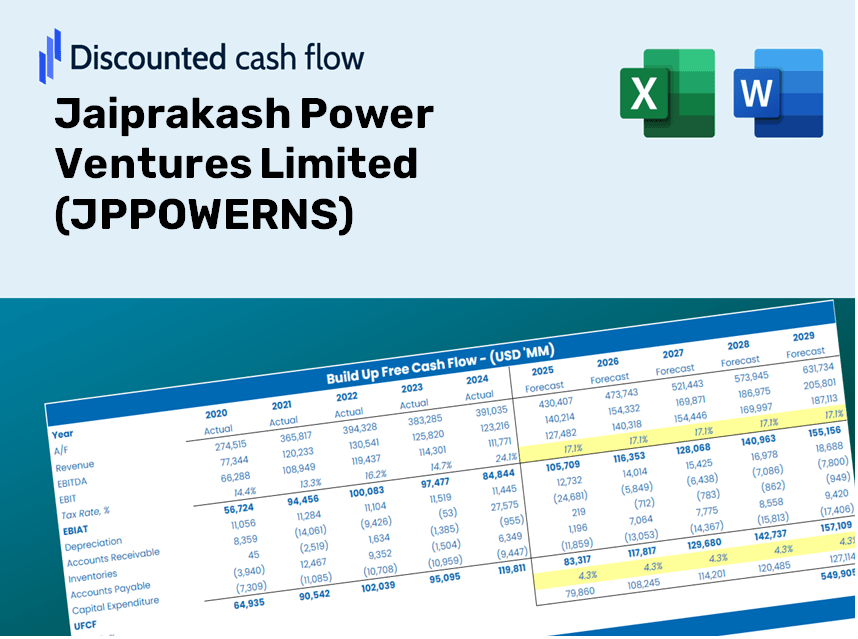
Jaiprakash Power Ventures Limited (JPPOWER.NS) DCF Valuation |
Fully Editable: Tailor To Your Needs In Excel Or Sheets
Professional Design: Trusted, Industry-Standard Templates
Investor-Approved Valuation Models
MAC/PC Compatible, Fully Unlocked
No Expertise Is Needed; Easy To Follow
Jaiprakash Power Ventures Limited (JPPOWER.NS) Bundle
Streamline Jaiprakash Power Ventures Limited (JPPOWERNS) valuation with our customizable DCF Calculator! Utilizing real Jaiprakash Power Ventures Limited (JPPOWERNS) financials and adjustable forecast inputs, you can quickly test various scenarios and determine Jaiprakash Power Ventures Limited (JPPOWERNS) fair value in just minutes.
Discounted Cash Flow (DCF) - (USD MM)
| Year | AY1 2021 |
AY2 2022 |
AY3 2023 |
AY4 2024 |
AY5 2025 |
FY1 2026 |
FY2 2027 |
FY3 2028 |
FY4 2029 |
FY5 2030 |
|---|---|---|---|---|---|---|---|---|---|---|
| Revenue | 33,017.1 | 46,245.5 | 57,866.7 | 67,627.8 | 57,075.5 | 66,558.5 | 77,617.1 | 90,513.1 | 105,551.7 | 123,089.0 |
| Revenue Growth, % | 0 | 40.07 | 25.13 | 16.87 | -15.6 | 16.61 | 16.61 | 16.61 | 16.61 | 16.61 |
| EBITDA | 13,958.5 | 13,478.5 | 12,493.5 | 21,635.4 | 20,999.8 | 21,538.0 | 25,116.5 | 29,289.5 | 34,155.9 | 39,830.9 |
| EBITDA, % | 42.28 | 29.15 | 21.59 | 31.99 | 36.79 | 32.36 | 32.36 | 32.36 | 32.36 | 32.36 |
| Depreciation | 4,799.5 | 4,812.8 | 4,642.0 | 4,651.1 | 4,702.0 | 6,400.4 | 7,463.8 | 8,703.9 | 10,150.1 | 11,836.5 |
| Depreciation, % | 14.54 | 10.41 | 8.02 | 6.88 | 8.24 | 9.62 | 9.62 | 9.62 | 9.62 | 9.62 |
| EBIT | 9,159.0 | 8,665.7 | 7,851.5 | 16,984.3 | 16,297.8 | 15,137.5 | 17,652.6 | 20,585.6 | 24,005.9 | 27,994.4 |
| EBIT, % | 27.74 | 18.74 | 13.57 | 25.11 | 28.55 | 22.74 | 22.74 | 22.74 | 22.74 | 22.74 |
| Total Cash | 401.9 | 619.4 | 586.1 | 310.4 | 8,925.4 | 2,617.9 | 3,052.9 | 3,560.1 | 4,151.6 | 4,841.4 |
| Total Cash, percent | .0 | .0 | .0 | .0 | .0 | .0 | .0 | .0 | .0 | .0 |
| Account Receivables | 8,016.3 | 10,465.9 | 13,905.0 | 11,863.9 | 9,432.3 | 13,978.4 | 16,300.9 | 19,009.3 | 22,167.7 | 25,850.8 |
| Account Receivables, % | 24.28 | 22.63 | 24.03 | 17.54 | 16.53 | 21 | 21 | 21 | 21 | 21 |
| Inventories | 1,999.4 | 5,187.0 | 7,121.9 | 5,235.5 | 5,825.4 | 6,326.7 | 7,377.9 | 8,603.7 | 10,033.2 | 11,700.2 |
| Inventories, % | 6.06 | 11.22 | 12.31 | 7.74 | 10.21 | 9.51 | 9.51 | 9.51 | 9.51 | 9.51 |
| Accounts Payable | 2,260.7 | 3,314.6 | 4,195.4 | 3,617.0 | 2,214.7 | 4,059.2 | 4,733.6 | 5,520.1 | 6,437.2 | 7,506.8 |
| Accounts Payable, % | 6.85 | 7.17 | 7.25 | 5.35 | 3.88 | 6.1 | 6.1 | 6.1 | 6.1 | 6.1 |
| Capital Expenditure | -515.9 | -1,030.5 | -1,198.3 | -1,986.9 | -2,427.5 | -1,737.5 | -2,026.2 | -2,362.9 | -2,755.5 | -3,213.3 |
| Capital Expenditure, % | -1.56 | -2.23 | -2.07 | -2.94 | -4.25 | -2.61 | -2.61 | -2.61 | -2.61 | -2.61 |
| Tax Rate, % | 33.07 | 33.07 | 33.07 | 33.07 | 33.07 | 33.07 | 33.07 | 33.07 | 33.07 | 33.07 |
| EBITAT | 7,252.9 | 3,000.0 | 1,930.3 | 13,894.7 | 10,907.3 | 8,692.8 | 10,137.1 | 11,821.4 | 13,785.5 | 16,075.9 |
| Depreciation | ||||||||||
| Changes in Account Receivables | ||||||||||
| Changes in Inventories | ||||||||||
| Changes in Accounts Payable | ||||||||||
| Capital Expenditure | ||||||||||
| UFCF | 3,781.5 | 2,199.0 | 880.8 | 19,908.0 | 13,621.2 | 10,152.7 | 12,875.5 | 15,014.7 | 17,509.4 | 20,418.5 |
| WACC, % | 5.41 | 4.5 | 4.3 | 5.47 | 5.16 | 4.97 | 4.97 | 4.97 | 4.97 | 4.97 |
| PV UFCF | ||||||||||
| SUM PV UFCF | 64,785.8 | |||||||||
| Long Term Growth Rate, % | 3.50 | |||||||||
| Free cash flow (T + 1) | 21,133 | |||||||||
| Terminal Value | 1,439,833 | |||||||||
| Present Terminal Value | 1,129,881 | |||||||||
| Enterprise Value | 1,194,667 | |||||||||
| Net Debt | 22,170 | |||||||||
| Equity Value | 1,172,497 | |||||||||
| Diluted Shares Outstanding, MM | 9,141 | |||||||||
| Equity Value Per Share | 128.27 |
What You Will Receive
- Comprehensive JPPOWERNS Financial Data: Pre-populated with Jaiprakash Power Ventures Limited’s historical and projected figures for accurate analysis.
- Customizable Template: Easily adjust key variables such as revenue growth, WACC, and EBITDA %.
- Instant Calculations: Witness the immediate update of Jaiprakash's intrinsic value based on your modifications.
- Professional Valuation Tool: Tailored for investors, analysts, and consultants aiming for precise DCF outcomes.
- User-Friendly Interface: Intuitive layout and straightforward instructions suitable for all skill levels.
Key Features
- Comprehensive JPPOWERNS Data: Pre-loaded with Jaiprakash Power Ventures Limited's historical financials and projected future performance.
- Fully Customizable Parameters: Modify assumptions for revenue growth, profit margins, WACC, tax rates, and capital investment.
- Interactive Valuation Model: Automatic recalculations of Net Present Value (NPV) and intrinsic value based on your customized inputs.
- Scenario Analysis: Develop various forecasting scenarios to evaluate different valuation outcomes.
- User-Friendly Interface: Designed to be intuitive and accessible for both professionals and newcomers.
How It Works
- Step 1: Download the prebuilt Excel template containing data for Jaiprakash Power Ventures Limited (JPPOWERNS).
- Step 2: Navigate through the filled sheets to familiarize yourself with the essential metrics.
- Step 3: Adjust forecasts and assumptions in the editable yellow cells (WACC, growth, margins).
- Step 4: Instantly see recalculated results, including the intrinsic value of Jaiprakash Power Ventures Limited (JPPOWERNS).
- Step 5: Use the outputs to make informed investment decisions or prepare comprehensive reports.
Why Choose This Calculator for Jaiprakash Power Ventures Limited (JPPOWERNS)?
- User-Friendly Interface: Crafted to accommodate both novices and seasoned professionals.
- Customizable Inputs: Modify assumptions effortlessly to tailor your analysis.
- Real-Time Updates: Watch Jaiprakash Power's valuation shift dynamically as you adjust the parameters.
- Preloaded Data: Comes equipped with Jaiprakash’s actual financial figures for immediate evaluation.
- Preferred by Experts: Utilized by investors and analysts for making well-informed choices.
Who Can Benefit from This Product?
- Investors: Effectively assess the fair value of Jaiprakash Power Ventures Limited (JPPOWERNS) prior to making investment choices.
- CFOs: Utilize a top-tier DCF model for accurate financial reporting and analysis.
- Consultants: Efficiently customize the template for valuation reports tailored to client needs.
- Entrepreneurs: Acquire valuable insights into the financial modeling practices of leading companies.
- Educators: Employ this resource as a teaching aid for illustrating various valuation techniques.
Contents of the Template
- Operating and Balance Sheet Data: Pre-filled historical data and forecasts for Jaiprakash Power Ventures Limited (JPPOWERNS), including revenue, EBITDA, EBIT, and capital expenditures.
- WACC Calculation: A specialized sheet for calculating the Weighted Average Cost of Capital (WACC), featuring key parameters such as Beta, risk-free rate, and share price.
- DCF Valuation (Unlevered and Levered): Customizable Discounted Cash Flow models that illustrate intrinsic value along with comprehensive calculations.
- Financial Statements: Pre-loaded annual and quarterly financial statements to facilitate thorough analysis.
- Key Ratios: Provides essential profitability, leverage, and efficiency ratios for Jaiprakash Power Ventures Limited (JPPOWERNS).
- Dashboard and Charts: A visual overview of valuation outputs and key assumptions, enabling easy analysis of results.
Disclaimer
All information, articles, and product details provided on this website are for general informational and educational purposes only. We do not claim any ownership over, nor do we intend to infringe upon, any trademarks, copyrights, logos, brand names, or other intellectual property mentioned or depicted on this site. Such intellectual property remains the property of its respective owners, and any references here are made solely for identification or informational purposes, without implying any affiliation, endorsement, or partnership.
We make no representations or warranties, express or implied, regarding the accuracy, completeness, or suitability of any content or products presented. Nothing on this website should be construed as legal, tax, investment, financial, medical, or other professional advice. In addition, no part of this site—including articles or product references—constitutes a solicitation, recommendation, endorsement, advertisement, or offer to buy or sell any securities, franchises, or other financial instruments, particularly in jurisdictions where such activity would be unlawful.
All content is of a general nature and may not address the specific circumstances of any individual or entity. It is not a substitute for professional advice or services. Any actions you take based on the information provided here are strictly at your own risk. You accept full responsibility for any decisions or outcomes arising from your use of this website and agree to release us from any liability in connection with your use of, or reliance upon, the content or products found herein.