
|
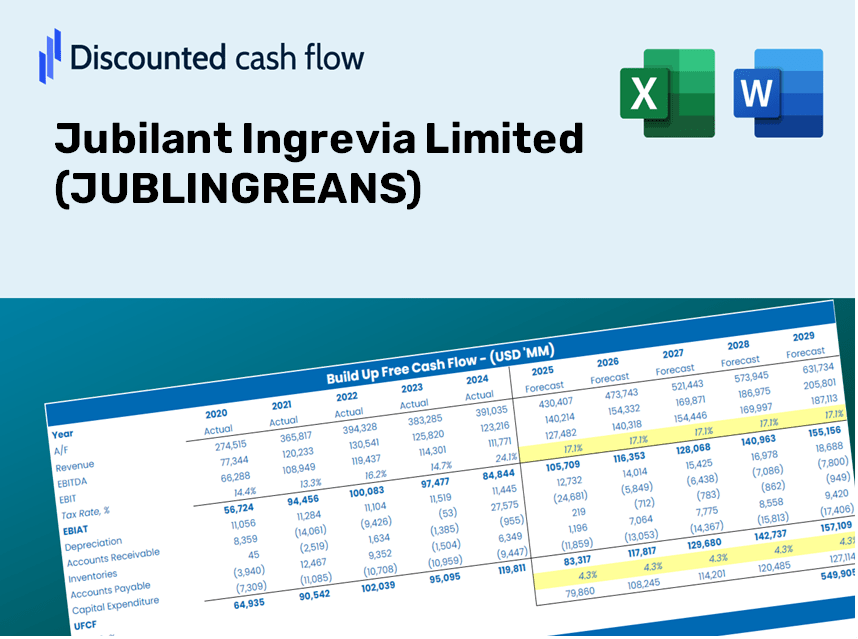
Jubilant Ingrevia Limited (JUBLINGREA.NS) DCF Valuation |
Fully Editable: Tailor To Your Needs In Excel Or Sheets
Professional Design: Trusted, Industry-Standard Templates
Investor-Approved Valuation Models
MAC/PC Compatible, Fully Unlocked
No Expertise Is Needed; Easy To Follow
Jubilant Ingrevia Limited (JUBLINGREA.NS) Bundle
Enhance your investment strategies with the (JUBLINGREANS) DCF Calculator! Utilize authentic Jubilant Ingrevia Limited financials, adjust growth projections and expenses, and instantly observe how these modifications affect the intrinsic value of (JUBLINGREANS).
Benefits You Will Receive
- Accurate JUBLINGREANS Financials: Provides both historical and projected data for precise evaluation.
- Customizable Inputs: Adjust parameters such as WACC, tax rates, revenue growth, and capital expenditures.
- Instant Calculations: Intrinsic value and NPV are computed in real-time.
- Scenario Analysis: Explore various scenarios to assess Jubilant Ingrevia Limited's future performance.
- User-Friendly Design: Crafted for professionals while remaining approachable for newcomers.
Key Features
- Comprehensive JUBLINGREANS Data: Pre-loaded with Jubilant Ingrevia Limited’s historical financial information and future projections.
- Tailorable Input Options: Modify revenue growth rates, profit margins, WACC, tax percentages, and capital expenditure plans to fit your analysis.
- Interactive Valuation Framework: Automatically refreshes Net Present Value (NPV) and intrinsic value according to your specified inputs.
- Scenario Analysis: Develop various forecasting scenarios to explore different valuation possibilities.
- Intuitive User Interface: Designed to be straightforward and accessible for both seasoned professionals and newcomers.
How It Works
- Step 1: Download the Excel file.
- Step 2: Review Jubilant Ingrevia Limited's (JUBLINGREANS) pre-filled financial data and forecasts.
- Step 3: Adjust key inputs such as revenue growth, WACC, and tax rates (highlighted cells).
- Step 4: Observe the DCF model refresh in real-time as you modify your assumptions.
- Step 5: Evaluate the outcomes and leverage the results for your investment strategies.
Why Choose the Jubilant Ingrevia Calculator?
- All-in-One Solution: Features DCF, WACC, and comprehensive financial ratio analyses in a single platform.
- Flexible Inputs: Modify the yellow-highlighted fields to explore different financial scenarios.
- In-Depth Analysis: Automatically computes the intrinsic value and Net Present Value for Jubilant Ingrevia Limited (JUBLINGREANS).
- Preloaded Information: Access to historical and projected data provides a solid foundation for analysis.
- Designed for Professionals: Perfectly suited for financial analysts, investors, and business consultants.
Who Can Benefit from JUBLINGREANS?
- Investors: Make informed investment choices with a reliable valuation tool tailored for JUBLINGREANS (JUBLINGREANS).
- Financial Analysts: Streamline your analysis process with a customizable DCF model designed specifically for JUBLINGREANS (JUBLINGREANS).
- Consultants: Effortlessly modify the template for impactful client presentations and reports related to JUBLINGREANS (JUBLINGREANS).
- Finance Enthusiasts: Enhance your knowledge of valuation methods through practical examples relevant to JUBLINGREANS (JUBLINGREANS).
- Educators and Students: Utilize this resource as an effective learning aid in finance courses that cover JUBLINGREANS (JUBLINGREANS).
Contents of the Template
- Pre-Filled DCF Model: Financial data for Jubilant Ingrevia Limited (JUBLINGREANS) already loaded for quick access.
- WACC Calculator: Comprehensive calculations for the Weighted Average Cost of Capital.
- Financial Ratios: Assess Jubilant Ingrevia's profitability, leverage, and operational efficiency.
- Editable Inputs: Modify assumptions such as growth rates, margins, and CAPEX to tailor your analysis.
- Financial Statements: Access annual and quarterly reports for in-depth evaluation.
- Interactive Dashboard: Visualize key valuation metrics and outcomes with ease.
Disclaimer
All information, articles, and product details provided on this website are for general informational and educational purposes only. We do not claim any ownership over, nor do we intend to infringe upon, any trademarks, copyrights, logos, brand names, or other intellectual property mentioned or depicted on this site. Such intellectual property remains the property of its respective owners, and any references here are made solely for identification or informational purposes, without implying any affiliation, endorsement, or partnership.
We make no representations or warranties, express or implied, regarding the accuracy, completeness, or suitability of any content or products presented. Nothing on this website should be construed as legal, tax, investment, financial, medical, or other professional advice. In addition, no part of this site—including articles or product references—constitutes a solicitation, recommendation, endorsement, advertisement, or offer to buy or sell any securities, franchises, or other financial instruments, particularly in jurisdictions where such activity would be unlawful.
All content is of a general nature and may not address the specific circumstances of any individual or entity. It is not a substitute for professional advice or services. Any actions you take based on the information provided here are strictly at your own risk. You accept full responsibility for any decisions or outcomes arising from your use of this website and agree to release us from any liability in connection with your use of, or reliance upon, the content or products found herein.