
|
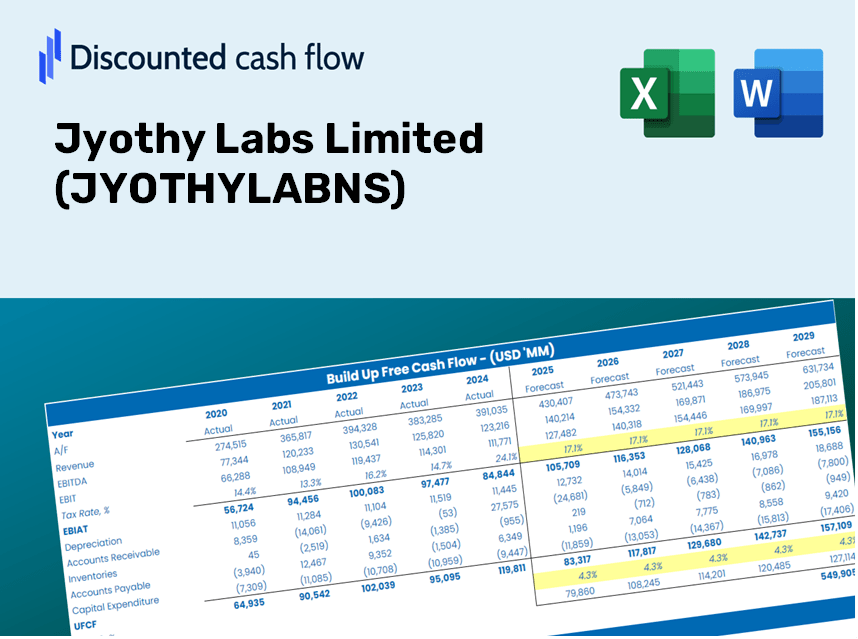
Jyothy Labs Limited (JYOTHYLAB.NS) DCF Valuation |
Fully Editable: Tailor To Your Needs In Excel Or Sheets
Professional Design: Trusted, Industry-Standard Templates
Investor-Approved Valuation Models
MAC/PC Compatible, Fully Unlocked
No Expertise Is Needed; Easy To Follow
Jyothy Labs Limited (JYOTHYLAB.NS) Bundle
Designed for accuracy, our (JYOTHYLABNS) DCF Calculator empowers you to evaluate the valuation of Jyothy Labs Limited using real-world financial data and complete flexibility to modify all essential parameters for enhanced projections.
What You Will Receive
- Modifiable Forecast Inputs: Effortlessly adjust key assumptions (growth %, profit margins, WACC) to explore various scenarios.
- Real-World Data: Financial data for Jyothy Labs Limited (JYOTHYLABNS) pre-included to kickstart your analysis.
- Automatic DCF Calculations: The template computes Net Present Value (NPV) and intrinsic value for you.
- Tailorable and Professional Design: A sleek Excel model that accommodates your valuation requirements.
- Designed for Analysts and Investors: Perfect for evaluating projections, confirming strategies, and enhancing efficiency.
Key Features
- 🔍 Real-Life JYOTHYLABNS Financials: Pre-filled historical and projected data for Jyothy Labs Limited.
- ✏️ Fully Customizable Inputs: Tailor all essential parameters (yellow cells) such as WACC, growth %, and tax rates.
- 📊 Professional DCF Valuation: Integrated formulas calculate Jyothy Labs’ intrinsic value utilizing the Discounted Cash Flow method.
- ⚡ Instant Results: View Jyothy Labs’ valuation immediately after adjustments are made.
- Scenario Analysis: Evaluate and compare outcomes of various financial assumptions side-by-side.
How It Works
- Step 1: Download the Excel file for Jyothy Labs Limited (JYOTHYLABNS).
- Step 2: Review the pre-filled financial data and forecasts for Jyothy Labs Limited.
- Step 3: Adjust key inputs such as revenue growth, WACC, and tax rates (highlighted cells).
- Step 4: Observe the DCF model update in real-time as you modify assumptions.
- Step 5: Analyze the results to inform your investment decisions regarding Jyothy Labs Limited.
Why Opt for Our Calculator?
- Precision: Leveraging authentic Jyothy Labs financial data guarantees accuracy.
- Adaptability: Tailored to allow users to freely test and adjust their inputs.
- Efficiency: Eliminate the complexities of creating a DCF model from the ground up.
- Expert-Level: Crafted with the expertise and usability expected by CFOs.
- Accessible: Intuitive design makes it easy for users without extensive financial modeling skills.
Who Should Use Jyothy Labs Limited (JYOTHYLABNS)?
- Institutional Investors: Develop comprehensive and dependable valuation models for investment evaluations.
- Corporate Finance Departments: Assess valuation scenarios to inform strategic planning and decision-making.
- Financial Consultants and Advisors: Deliver precise valuation insights for Jyothy Labs Limited (JYOTHYLABNS) to clients.
- Students and Educators: Utilize real-market data to enhance learning and practice in financial modeling.
- Business Enthusiasts: Gain insights into how companies like Jyothy Labs Limited (JYOTHYLABNS) are valued within the industry.
Components of the Template
- Preloaded JYOTHYLABNS Data: Historical and future financial metrics, such as revenue, EBIT, and capital expenditures.
- DCF and WACC Models: Advanced spreadsheets designed for calculating intrinsic value and Weighted Average Cost of Capital.
- Editable Inputs: Yellow-highlighted cells for modifying revenue growth rates, tax percentages, and discount factors.
- Financial Statements: Detailed annual and quarterly financial reports for in-depth analysis.
- Key Ratios: Metrics for profitability, leverage, and efficiency to assess overall performance.
- Dashboard and Charts: Visual representations of valuation results and underlying assumptions.
Disclaimer
All information, articles, and product details provided on this website are for general informational and educational purposes only. We do not claim any ownership over, nor do we intend to infringe upon, any trademarks, copyrights, logos, brand names, or other intellectual property mentioned or depicted on this site. Such intellectual property remains the property of its respective owners, and any references here are made solely for identification or informational purposes, without implying any affiliation, endorsement, or partnership.
We make no representations or warranties, express or implied, regarding the accuracy, completeness, or suitability of any content or products presented. Nothing on this website should be construed as legal, tax, investment, financial, medical, or other professional advice. In addition, no part of this site—including articles or product references—constitutes a solicitation, recommendation, endorsement, advertisement, or offer to buy or sell any securities, franchises, or other financial instruments, particularly in jurisdictions where such activity would be unlawful.
All content is of a general nature and may not address the specific circumstances of any individual or entity. It is not a substitute for professional advice or services. Any actions you take based on the information provided here are strictly at your own risk. You accept full responsibility for any decisions or outcomes arising from your use of this website and agree to release us from any liability in connection with your use of, or reliance upon, the content or products found herein.