
|
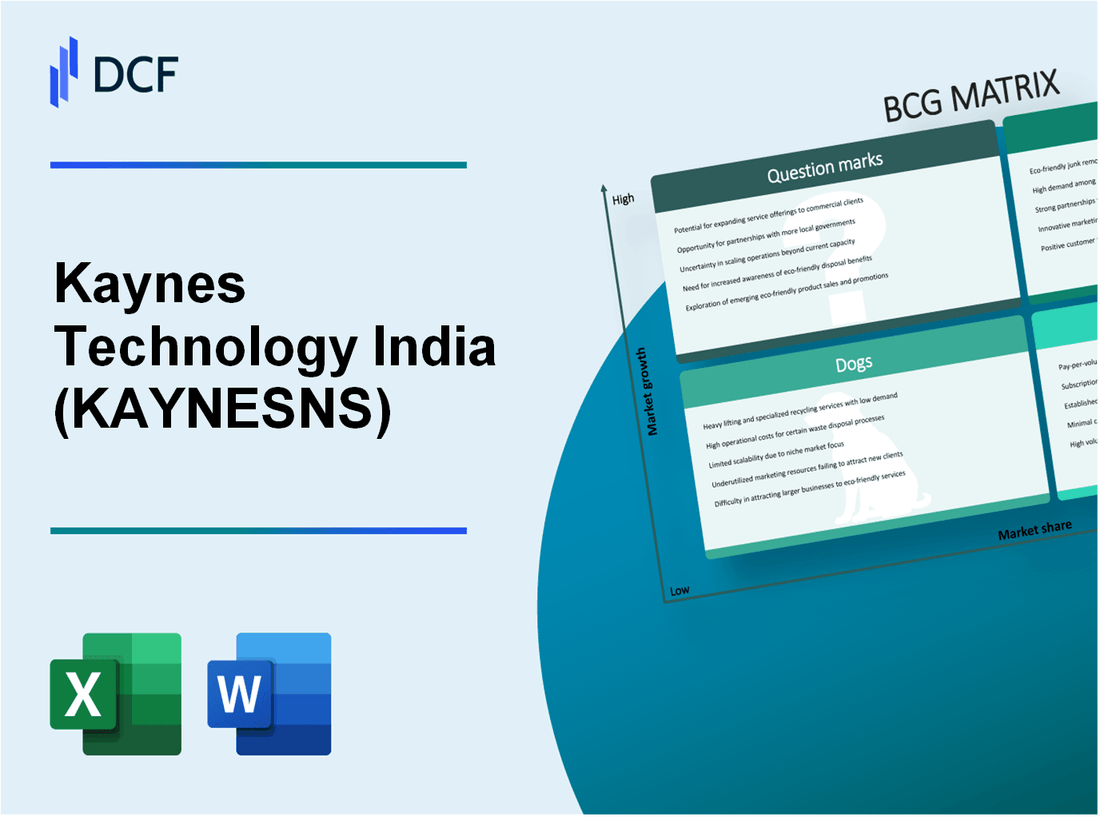
Kaynes Technology India Limited (KAYNES.NS): BCG Matrix |
Fully Editable: Tailor To Your Needs In Excel Or Sheets
Professional Design: Trusted, Industry-Standard Templates
Investor-Approved Valuation Models
MAC/PC Compatible, Fully Unlocked
No Expertise Is Needed; Easy To Follow
Kaynes Technology India Limited (KAYNES.NS) Bundle
In the fast-paced world of technology, understanding a company's strategic positioning is crucial for investors and stakeholders alike. Kaynes Technology India Limited, with its diverse product offerings and evolving market landscape, provides a fascinating case study through the lens of the Boston Consulting Group Matrix. Join us as we dissect the Stars, Cash Cows, Dogs, and Question Marks within this innovative firm, uncovering insights that can guide investment decisions and future growth trajectories.
Background of Kaynes Technology India Limited
Founded in 1992, Kaynes Technology India Limited is a prominent player in the electronics manufacturing services (EMS) sector. Headquartered in Mysuru, Karnataka, the company specializes in providing a wide range of solutions, including design, manufacturing, and supply chain management for electronic products.
Kaynes Technology has a diverse portfolio that caters to various industries such as automotive, defense, aerospace, healthcare, and industrial automation. The company aims to meet the growing demand for high-quality electronic components, leveraging its state-of-the-art facilities and technological expertise.
As of the latest fiscal year, Kaynes reported revenues exceeding INR 1,000 crore, showcasing substantial growth in the EMS segment. The company has strategically invested in expanding its production capabilities, enhancing its research and development efforts, and forming key partnerships within the industry.
With a commitment to innovation, Kaynes Technology has effectively positioned itself to capitalize on the increasing global trends in electronics, particularly in the context of the ongoing digital transformation and the push towards sustainability in manufacturing practices.
In 2022, the company went public, reflecting its robust business model and growth potential. The IPO was met with strong investor interest, highlighting confidence in its operational efficiency and market prospects.
Kaynes Technology continues to strengthen its footprint in the EMS landscape, with a strong emphasis on quality, customer satisfaction, and operational excellence, making it a key player in the Indian electronics sector.
Kaynes Technology India Limited - BCG Matrix: Stars
In the context of Kaynes Technology India Limited, the Stars are identified in high growth potential market segments, particularly in the electronics manufacturing and technology solutions sectors. According to the latest market reports, the global electronics manufacturing services (EMS) market is projected to grow at a CAGR of approximately 6.1% from 2021 to 2028.
High Growth Potential Market Segments
Kaynes Technology has strategically positioned itself in sectors such as electric vehicles (EVs) and renewable energy, both of which are witnessing significant growth. The Indian EV market is expected to grow from ₹1,500 crore in 2020 to approximately ₹3,000 crore by 2025, reflecting a growth rate of about 20%. Additionally, the demand for renewable energy solutions continues to expand, with the Indian solar power market targeting a capacity of 100 GW by 2022.
Leading Technology Solutions
Kaynes Technology offers competitive products such as PCB assemblies, IoT solutions, and advanced manufacturing services. The company reported a revenue of ₹450 crore for the financial year 2022, with an increase of 25% year-on-year. Its significant market share in the PCB assembly domain positions it favorably against competitors, as it holds around 15% of the Indian market share within this segment.
Strong Competitive Advantage
Kaynes has established a robust competitive advantage through state-of-the-art technology and strategic partnerships. Its investments in R&D amounting to ₹30 crore annually underpins its innovative capabilities. Furthermore, the company’s capacity to scale production efficiently reinforces its market dominance. In a recent analysis, Kaynes Technology was noted to have a gross margin of 35%, outpacing many of its peers due to operational efficiencies.
| Market Segment | Current Growth Rate | Projected Market Size (2025) | Market Share (%) |
|---|---|---|---|
| Electric Vehicles | 20% | ₹3,000 crore | 12% |
| Renewable Energy | 15% | ₹1,500 crore | 10% |
| PCB Assembly | 10% | ₹2,000 crore | 15% |
| IoT Solutions | 25% | ₹500 crore | 8% |
The strategic focus on these segments not only enhances Kaynes Technology's financial performance but also solidifies its position as a leader in high growth industries, ensuring sustained investment to maintain its status as a Star within the BCG Matrix.
Kaynes Technology India Limited - BCG Matrix: Cash Cows
Kaynes Technology India Limited has established a strong portfolio of cash cows within its operations, showcasing products that dominate the market with high shares in a mature segment. These products typically yield high profit margins while requiring minimal investment to maintain. The focus of the company remains on leveraging these established product lines to generate consistent revenue.
Established Product Lines
Among Kaynes Technology's noteworthy established products, the Electronic Manufacturing Services (EMS) play a significant role. The EMS sector alone contributed approximately ₹325 crore to the revenue in the fiscal year 2022-2023. The company has fortified its presence in sectors such as automotive electronics, industrial applications, and defense electronics, all of which have seen steady demand.
Consistent Revenue Streams
The company's cash cows have been integral in providing stable revenue. For instance, in Q1 of FY 2023-2024, Kaynes reported total revenues of ₹90 crore, with EMS contributing nearly 70% of that figure. This consistency allows Kaynes to maintain operational effectiveness while also managing financial stability. The EBITDA margin for the EMS segment stood at a robust 18%, which is indicative of the profitability inherent in these cash cows.
Stable Market Position
Kaynes Technology has secured a stable market position through strategic investments in technology and capacity. The company's market share in the EMS domain is estimated at around 15% nationally, making it one of the leaders in this mature market. This position is further bolstered by long-term contracts with key clients in both domestic and international markets, ensuring steady cash flow. As a result, Kaynes generated free cash flow of approximately ₹50 crore in the last fiscal year.
| Key Metrics | Fiscal Year 2022-2023 | Q1 FY 2023-2024 |
|---|---|---|
| Total Revenue (₹ Crore) | ₹325 | ₹90 |
| EMS Contribution (%) | 70% | 70% |
| EBITDA Margin (%) | 18% | N/A |
| Market Share (%) | 15% | N/A |
| Free Cash Flow (₹ Crore) | ₹50 | N/A |
In summary, Kaynes Technology India Limited's cash cows form the backbone of its financial health, ensuring that it maintains a competitive edge in a stable market while providing the necessary capital to support growth in other areas of the business.
Kaynes Technology India Limited - BCG Matrix: Dogs
The business units classified as Dogs within Kaynes Technology India Limited indicate a challenging position in the market. These units exhibit low growth potential and minimal market share, representing a significant challenge for the company.
Declining or stagnant product demand
In FY 2022-2023, certain product lines within Kaynes Technology have shown a decline in demand, with a revenue drop of 12% year-over-year. This decline has been attributed to the saturation of specific markets and increased competition, leading to a stagnant growth trajectory.
Low market share
Products categorized as Dogs within the portfolio command a market share of less than 5% in their respective segments. For instance, the company's offerings in specific consumer electronics struggled, with market penetration shrinking amidst competitive pressures, showcasing the limitations of these products in generating significant revenue.
Minimal profit contribution
Financial analysis highlights that these Dogs contribute less than 3% to the overall profit margins of Kaynes Technology. In the latest earnings report for Q2 2023, units categorized as Dogs collectively incurred losses amounting to ₹25 million, indicating their struggle to contribute positively to the company's financial health.
| Product Line | Market Share (%) | Revenue FY 2022-2023 (₹ millions) | Profit Contribution (%) | Year-over-Year Growth (%) |
|---|---|---|---|---|
| Product A | 4% | 50 | -1% | -10% |
| Product B | 3% | 30 | -1% | -15% |
| Product C | 2% | 20 | 0% | -5% |
| Product D | 1% | 10 | -2% | -20% |
Overall, the Dogs category within Kaynes Technology India Limited remains a critical concern. These products are not only characterized by low market share and stagnant growth but also represent a drain on resources, making it imperative for the company to reassess its investment in these units.
Kaynes Technology India Limited - BCG Matrix: Question Marks
In the context of Kaynes Technology India Limited, Question Marks represent business units or products operating in high-growth markets but possessing low market share. These segments require strategic focus to either enhance their performance or decide on divestment.
Emerging technologies with uncertain potential
Kaynes Technology focuses on several emerging technologies, particularly in the areas of electronic manufacturing services (EMS) and Internet of Things (IoT) solutions. In FY2023, the revenue from new technology initiatives was approximately INR 150 crore, accounting for about 10% of total revenue. These segments, while showing promise, have not yet captured a significant portion of the market.
New market entry initiatives
Kaynes Technology has recently ventured into new markets, including electric vehicles (EV) and 5G solutions. The company allocated roughly INR 200 crore in R&D for these initiatives in FY2023. However, despite potential high demand, the current market share in these sectors stands at approximately 5%, indicating that while the company is positioned in high-growth industries, its presence remains minimal.
High investment with unpredictable outcomes
The financial implications of managing Question Marks involve substantial investments without guaranteed returns. For instance, Kaynes Technology reported an EBITDA margin of 8% in its emerging tech segments, reflective of high operating costs associated with developing new products. In the same fiscal year, the company documented net losses of around INR 30 crore from its IoT solutions and EV initiatives, underlining the financial strain caused by these investments.
| Category | Investment (INR Crores) | Market Share (%) | Revenue (INR Crores) | EBITDA Margin (%) | Net Loss (INR Crores) |
|---|---|---|---|---|---|
| Emerging Technologies | 150 | 10 | 150 | 8 | 30 |
| Electric Vehicles | 100 | 5 | 50 | 7 | 10 |
| 5G Solutions | 100 | 5 | 60 | 6 | 15 |
To navigate the complexities of these Question Marks, Kaynes Technology is at a crossroads: either ramp up investments to bolster market share or reevaluate the long-term potential of these emerging products. The decisions made in this regard will significantly impact the company's overall growth trajectory and market positioning in the technology sector.
The BCG Matrix provides a powerful lens through which to evaluate Kaynes Technology India Limited's diverse portfolio, revealing the dynamics of its Stars, Cash Cows, Dogs, and Question Marks. By understanding where each segment stands, investors can make informed decisions that capitalize on growth opportunities while managing risks effectively in this rapidly evolving sector.
[right_small]Disclaimer
All information, articles, and product details provided on this website are for general informational and educational purposes only. We do not claim any ownership over, nor do we intend to infringe upon, any trademarks, copyrights, logos, brand names, or other intellectual property mentioned or depicted on this site. Such intellectual property remains the property of its respective owners, and any references here are made solely for identification or informational purposes, without implying any affiliation, endorsement, or partnership.
We make no representations or warranties, express or implied, regarding the accuracy, completeness, or suitability of any content or products presented. Nothing on this website should be construed as legal, tax, investment, financial, medical, or other professional advice. In addition, no part of this site—including articles or product references—constitutes a solicitation, recommendation, endorsement, advertisement, or offer to buy or sell any securities, franchises, or other financial instruments, particularly in jurisdictions where such activity would be unlawful.
All content is of a general nature and may not address the specific circumstances of any individual or entity. It is not a substitute for professional advice or services. Any actions you take based on the information provided here are strictly at your own risk. You accept full responsibility for any decisions or outcomes arising from your use of this website and agree to release us from any liability in connection with your use of, or reliance upon, the content or products found herein.