
|
KEC International Limited (KEC.NS) DCF Valuation |
Fully Editable: Tailor To Your Needs In Excel Or Sheets
Professional Design: Trusted, Industry-Standard Templates
Investor-Approved Valuation Models
MAC/PC Compatible, Fully Unlocked
No Expertise Is Needed; Easy To Follow
KEC International Limited (KEC.NS) Bundle
As an investor or analyst, this KEC International Limited (KECNS) DCF Calculator serves as your go-to resource for accurate valuation. With real data from KEC International Limited preloaded, you can adjust forecasts and immediately observe the effects.
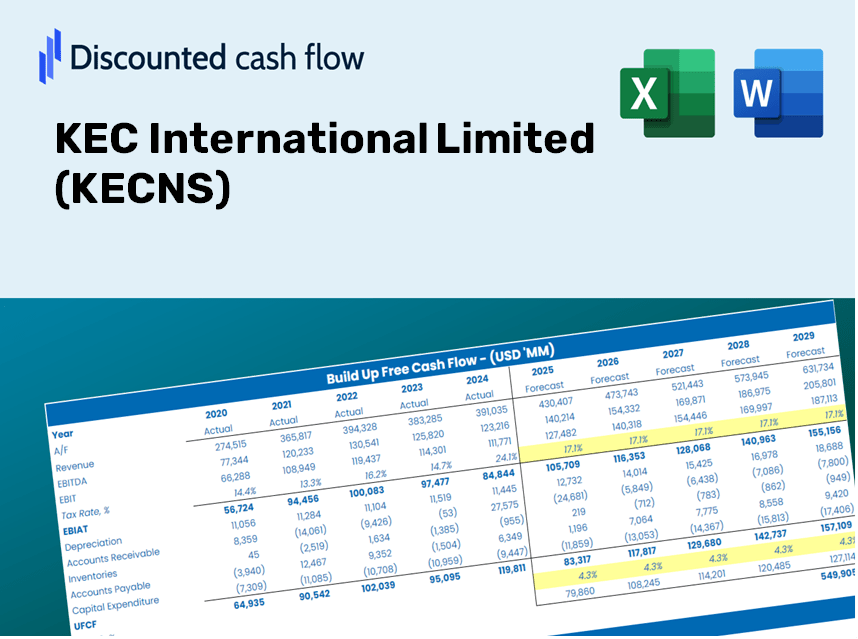
Discounted Cash Flow (DCF) - (USD MM)
| Year | AY1 2021 |
AY2 2022 |
AY3 2023 |
AY4 2024 |
AY5 2025 |
FY1 2026 |
FY2 2027 |
FY3 2028 |
FY4 2029 |
FY5 2030 |
|---|---|---|---|---|---|---|---|---|---|---|
| Revenue | 131,142.0 | 137,422.6 | 172,817.1 | 199,141.7 | 218,467.0 | 248,769.5 | 283,275.1 | 322,566.8 | 367,308.5 | 418,256.0 |
| Revenue Growth, % | 0 | 4.79 | 25.76 | 15.23 | 9.7 | 13.87 | 13.87 | 13.87 | 13.87 | 13.87 |
| EBITDA | 12,689.2 | 9,698.1 | 9,782.1 | 12,618.2 | 15,039.0 | 17,719.2 | 20,176.9 | 22,975.5 | 26,162.4 | 29,791.2 |
| EBITDA, % | 9.68 | 7.06 | 5.66 | 6.34 | 6.88 | 7.12 | 7.12 | 7.12 | 7.12 | 7.12 |
| Depreciation | 1,525.3 | 1,578.6 | 1,614.8 | 1,853.6 | 1,836.8 | 2,496.5 | 2,842.8 | 3,237.1 | 3,686.1 | 4,197.4 |
| Depreciation, % | 1.16 | 1.15 | 0.9344 | 0.93079 | 0.84077 | 1 | 1 | 1 | 1 | 1 |
| EBIT | 11,163.9 | 8,119.5 | 8,167.3 | 10,764.6 | 13,202.2 | 15,222.6 | 17,334.1 | 19,738.4 | 22,476.2 | 25,593.8 |
| EBIT, % | 8.51 | 5.91 | 4.73 | 5.41 | 6.04 | 6.12 | 6.12 | 6.12 | 6.12 | 6.12 |
| Total Cash | 2,027.0 | 2,765.1 | 2,873.0 | 2,055.6 | 6,559.3 | 4,604.7 | 5,243.3 | 5,970.6 | 6,798.8 | 7,741.8 |
| Total Cash, percent | .0 | .0 | .0 | .0 | .0 | .0 | .0 | .0 | .0 | .0 |
| Account Receivables | 98,842.3 | 111,993.3 | 117,472.8 | 132,249.9 | 160,999.3 | 181,574.9 | 206,760.3 | 235,439.0 | 268,095.6 | 305,281.9 |
| Account Receivables, % | 75.37 | 81.5 | 67.98 | 66.41 | 73.7 | 72.99 | 72.99 | 72.99 | 72.99 | 72.99 |
| Inventories | 8,422.0 | 10,664.8 | 11,371.6 | 12,133.1 | 11,404.6 | 15,958.9 | 18,172.5 | 20,693.1 | 23,563.4 | 26,831.8 |
| Inventories, % | 6.42 | 7.76 | 6.58 | 6.09 | 5.22 | 6.42 | 6.42 | 6.42 | 6.42 | 6.42 |
| Accounts Payable | 61,702.7 | 68,473.3 | 83,883.3 | 92,069.8 | 105,034.8 | 119,273.7 | 135,817.5 | 154,656.1 | 176,107.7 | 200,534.8 |
| Accounts Payable, % | 47.05 | 49.83 | 48.54 | 46.23 | 48.08 | 47.95 | 47.95 | 47.95 | 47.95 | 47.95 |
| Capital Expenditure | -1,800.7 | -1,431.4 | -1,782.9 | -2,373.8 | -1,825.2 | -2,723.4 | -3,101.2 | -3,531.4 | -4,021.2 | -4,578.9 |
| Capital Expenditure, % | -1.37 | -1.04 | -1.03 | -1.19 | -0.83546 | -1.09 | -1.09 | -1.09 | -1.09 | -1.09 |
| Tax Rate, % | 21.55 | 21.55 | 21.55 | 21.55 | 21.55 | 21.55 | 21.55 | 21.55 | 21.55 | 21.55 |
| EBITAT | 8,163.0 | 6,750.4 | 8,930.9 | 8,752.7 | 10,357.6 | 12,665.9 | 14,422.7 | 16,423.2 | 18,701.2 | 21,295.1 |
| Depreciation | ||||||||||
| Changes in Account Receivables | ||||||||||
| Changes in Inventories | ||||||||||
| Changes in Accounts Payable | ||||||||||
| Capital Expenditure | ||||||||||
| UFCF | -37,674.0 | -1,725.6 | 17,986.5 | 880.4 | -4,686.7 | 1,547.9 | 3,309.2 | 3,768.2 | 4,290.9 | 4,886.1 |
| WACC, % | 5.84 | 6.1 | 6.54 | 6.05 | 5.98 | 6.1 | 6.1 | 6.1 | 6.1 | 6.1 |
| PV UFCF | ||||||||||
| SUM PV UFCF | 14,571.5 | |||||||||
| Long Term Growth Rate, % | 4.00 | |||||||||
| Free cash flow (T + 1) | 5,082 | |||||||||
| Terminal Value | 241,490 | |||||||||
| Present Terminal Value | 179,571 | |||||||||
| Enterprise Value | 194,142 | |||||||||
| Net Debt | 33,016 | |||||||||
| Equity Value | 161,127 | |||||||||
| Diluted Shares Outstanding, MM | 262 | |||||||||
| Equity Value Per Share | 615.44 |
Your Benefits
- Authentic KECNS Financials: Access historical and projected data for precise valuation.
- Customizable Inputs: Adjust WACC, tax rates, revenue growth, and capital expenditures to fit your analysis.
- Automated Calculations: Intrinsic value and NPV are computed in real-time.
- Scenario Analysis: Explore various scenarios to assess KEC International Limited’s future performance.
- User-Friendly Design: Designed for professionals but easy to navigate for newcomers.
Key Features
- 🔍 Real-Life KEC International Financials: Pre-filled historical and projected data for KEC International Limited (KECNS).
- ✏️ Fully Customizable Inputs: Adjust all key parameters (yellow cells) such as WACC, growth %, and tax rates.
- 📊 Professional DCF Valuation: Built-in formulas compute KEC’s intrinsic value using the Discounted Cash Flow method.
- ⚡ Instant Results: Visualize KEC’s valuation immediately after making adjustments.
- Scenario Analysis: Evaluate and compare outcomes for various financial assumptions side-by-side.
How It Works
- Step 1: Download the Excel file.
- Step 2: Review KEC International Limited's (KECNS) pre-filled financial data and projections.
- Step 3: Adjust key inputs such as revenue growth, WACC, and tax rates (highlighted cells).
- Step 4: Observe as the DCF model updates in real-time with your adjusted assumptions.
- Step 5: Evaluate the results and leverage the findings for your investment strategies.
Why Opt for KEC International Limited's Calculator?
- Time-Efficient: Skip the hassle of building a DCF model from the ground up – our solution is ready for immediate use.
- Enhanced Accuracy: Dependable financial data and formulas minimize valuation errors.
- Completely Customizable: Adjust the model to align with your specific assumptions and projections.
- Intuitive Design: User-friendly charts and outputs simplify data analysis.
- Endorsed by Professionals: Crafted for experts who prioritize both precision and usability.
Who Can Benefit from This Product?
- Investors: Accurately assess KEC International Limited’s (KECNS) intrinsic value prior to making investment choices.
- CFOs: Utilize a sophisticated DCF model for comprehensive financial reporting and analysis on KECNS.
- Consultants: Effortlessly customize the template for client valuation reports involving KEC International Limited.
- Entrepreneurs: Acquire valuable insights into the financial modeling techniques employed by leading firms, including KECNS.
- Educators: Employ this tool as a resource to illustrate valuation methods using KEC International Limited as a case study.
Contents of the Template
- Preloaded KEC Data: Historical and projected financial metrics, including revenue, EBIT, and capital expenditures.
- DCF and WACC Models: Advanced sheets for calculating intrinsic value and Weighted Average Cost of Capital.
- Editable Inputs: Yellow-highlighted cells for customizing revenue growth, tax rates, and discount rates.
- Financial Statements: Detailed annual and quarterly financials for in-depth analysis.
- Key Ratios: Profitability, leverage, and efficiency ratios for performance evaluation.
- Dashboard and Charts: Visual representations of valuation results and underlying assumptions.
Disclaimer
All information, articles, and product details provided on this website are for general informational and educational purposes only. We do not claim any ownership over, nor do we intend to infringe upon, any trademarks, copyrights, logos, brand names, or other intellectual property mentioned or depicted on this site. Such intellectual property remains the property of its respective owners, and any references here are made solely for identification or informational purposes, without implying any affiliation, endorsement, or partnership.
We make no representations or warranties, express or implied, regarding the accuracy, completeness, or suitability of any content or products presented. Nothing on this website should be construed as legal, tax, investment, financial, medical, or other professional advice. In addition, no part of this site—including articles or product references—constitutes a solicitation, recommendation, endorsement, advertisement, or offer to buy or sell any securities, franchises, or other financial instruments, particularly in jurisdictions where such activity would be unlawful.
All content is of a general nature and may not address the specific circumstances of any individual or entity. It is not a substitute for professional advice or services. Any actions you take based on the information provided here are strictly at your own risk. You accept full responsibility for any decisions or outcomes arising from your use of this website and agree to release us from any liability in connection with your use of, or reliance upon, the content or products found herein.