
|
KKR & Co. Inc. (KKR) DCF Valuation |
Fully Editable: Tailor To Your Needs In Excel Or Sheets
Professional Design: Trusted, Industry-Standard Templates
Investor-Approved Valuation Models
MAC/PC Compatible, Fully Unlocked
No Expertise Is Needed; Easy To Follow
KKR & Co. Inc. (KKR) Bundle
Looking to assess KKR & Co. Inc.'s intrinsic value? Our KKR DCF Calculator offers real-world data along with extensive customization features, allowing you to refine forecasts and enhance your investment choices.
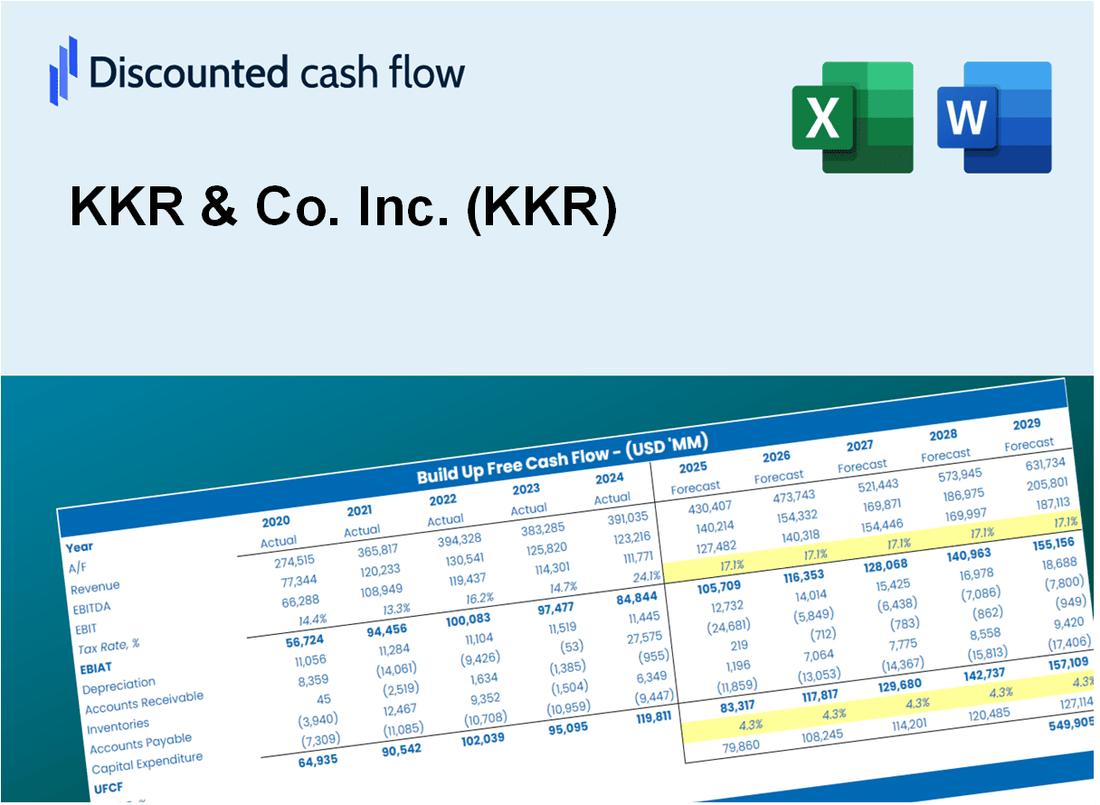
Discounted Cash Flow (DCF) - (USD MM)
| Year | AY1 2020 |
AY2 2021 |
AY3 2022 |
AY4 2023 |
AY5 2024 |
FY1 2025 |
FY2 2026 |
FY3 2027 |
FY4 2028 |
FY5 2029 |
|---|---|---|---|---|---|---|---|---|---|---|
| Revenue | 4,230.9 | 16,105.8 | 5,565.1 | 14,322.9 | 21,640.3 | 31,683.7 | 46,388.2 | 67,917.2 | 99,438.0 | 145,587.7 |
| Revenue Growth, % | 0 | 280.67 | -65.45 | 157.37 | 51.09 | 46.41 | 46.41 | 46.41 | 46.41 | 46.41 |
| EBITDA | 6,696.6 | 14,978.6 | 1,345.7 | 9,500.6 | 9,166.3 | 20,649.7 | 30,233.3 | 44,264.7 | 64,808.2 | 94,886.0 |
| EBITDA, % | 158.28 | 93 | 24.18 | 66.33 | 42.36 | 65.17 | 65.17 | 65.17 | 65.17 | 65.17 |
| Depreciation | .0 | .0 | .0 | .0 | .0 | .0 | .0 | .0 | .0 | .0 |
| Depreciation, % | 0 | 0 | 0 | 0 | 0 | 0 | 0 | 0 | 0 | 0 |
| EBIT | 6,696.6 | 14,978.6 | 1,345.7 | 9,500.6 | 9,166.3 | 20,649.7 | 30,233.3 | 44,264.7 | 64,808.2 | 94,886.0 |
| EBIT, % | 158.28 | 93 | 24.18 | 66.33 | 42.36 | 65.17 | 65.17 | 65.17 | 65.17 | 65.17 |
| Total Cash | 6,507.9 | 10,091.6 | 12,823.6 | 108,568.2 | 112,557.7 | 29,317.4 | 42,923.8 | 62,844.9 | 92,011.6 | 134,714.6 |
| Total Cash, percent | .0 | .0 | .0 | .0 | .0 | .0 | .0 | .0 | .0 | .0 |
| Account Receivables | 1,935.9 | 29,008.6 | 30,120.7 | 82,147.5 | 105,203.1 | 28,246.4 | 41,355.6 | 60,549.0 | 88,650.1 | 129,793.1 |
| Account Receivables, % | 45.76 | 180.11 | 541.25 | 573.54 | 486.14 | 89.15 | 89.15 | 89.15 | 89.15 | 89.15 |
| Inventories | .0 | .0 | .0 | .0 | .0 | .0 | .0 | .0 | .0 | .0 |
| Inventories, % | 0 | 0 | 0 | 0 | 0 | 0 | 0 | 0 | 0 | 0 |
| Accounts Payable | 2,047.3 | 3,863.9 | 2,114.5 | 2,918.6 | 4,627.9 | 9,640.7 | 14,115.0 | 20,665.9 | 30,257.1 | 44,299.5 |
| Accounts Payable, % | 48.39 | 23.99 | 38 | 20.38 | 21.39 | 30.43 | 30.43 | 30.43 | 30.43 | 30.43 |
| Capital Expenditure | -153.4 | -102.0 | -85.1 | -108.4 | -141.5 | -456.1 | -667.8 | -977.8 | -1,431.6 | -2,095.9 |
| Capital Expenditure, % | -3.63 | -0.63362 | -1.53 | -0.75678 | -0.65404 | -1.44 | -1.44 | -1.44 | -1.44 | -1.44 |
| Tax Rate, % | 47.51 | 47.51 | 47.51 | 47.51 | 47.51 | 47.51 | 47.51 | 47.51 | 47.51 | 47.51 |
| EBITAT | 2,341.7 | 5,119.3 | 2,402.4 | 5,409.7 | 4,811.6 | 11,505.1 | 16,844.7 | 24,662.4 | 36,108.3 | 52,866.4 |
| Depreciation | ||||||||||
| Changes in Account Receivables | ||||||||||
| Changes in Inventories | ||||||||||
| Changes in Accounts Payable | ||||||||||
| Capital Expenditure | ||||||||||
| UFCF | 2,299.7 | -20,238.9 | -544.2 | -45,921.3 | -16,676.3 | 93,018.5 | 7,541.9 | 11,042.1 | 16,166.8 | 23,669.9 |
| WACC, % | 9.79 | 9.77 | 11.1 | 10.23 | 10.14 | 10.21 | 10.21 | 10.21 | 10.21 | 10.21 |
| PV UFCF | ||||||||||
| SUM PV UFCF | 124,385.2 | |||||||||
| Long Term Growth Rate, % | 2.00 | |||||||||
| Free cash flow (T + 1) | 24,143 | |||||||||
| Terminal Value | 294,241 | |||||||||
| Present Terminal Value | 181,006 | |||||||||
| Enterprise Value | 305,391 | |||||||||
| Net Debt | 35,938 | |||||||||
| Equity Value | 269,453 | |||||||||
| Diluted Shares Outstanding, MM | 939 | |||||||||
| Equity Value Per Share | 286.99 |
What You Will Get
- Comprehensive KKR Financials: Access to historical and projected data for precise valuation.
- Customizable Inputs: Adjust WACC, tax rates, revenue growth, and capital expenditures as needed.
- Real-Time Calculations: Intrinsic value and NPV are computed automatically.
- Scenario Analysis: Evaluate various scenarios to assess KKR’s future performance.
- User-Friendly Design: Designed for professionals while remaining accessible to newcomers.
Key Features
- 🔍 Real-Life KKR Financials: Pre-filled historical and projected data for KKR & Co. Inc. (KKR).
- ✏️ Fully Customizable Inputs: Adjust all critical parameters (yellow cells) like WACC, growth %, and tax rates.
- 📊 Professional DCF Valuation: Built-in formulas calculate KKR’s intrinsic value using the Discounted Cash Flow method.
- ⚡ Instant Results: Visualize KKR’s valuation instantly after making changes.
- Scenario Analysis: Test and compare outcomes for various financial assumptions side-by-side.
How It Works
- 1. Access the Template: Download and open the Excel file containing KKR & Co. Inc.'s (KKR) comprehensive data.
- 2. Adjust Key Inputs: Modify essential parameters such as growth projections, WACC, and capital expenditures.
- 3. Analyze Results in Real-Time: The DCF model automatically computes intrinsic value and NPV based on your inputs.
- 4. Explore Various Scenarios: Evaluate different forecasts to understand a range of valuation possibilities.
- 5. Present with Assurance: Share professional valuation analyses to back up your strategic decisions.
Why Choose This Calculator for KKR & Co. Inc. (KKR)?
- Designed for Experts: A sophisticated tool tailored for investors, analysts, and financial advisors.
- Comprehensive Data: KKR’s historical and projected financials integrated for precise analysis.
- Flexible Scenario Analysis: Easily model various forecasts and assumptions to test different outcomes.
- Insightful Outputs: Automatically computes intrinsic value, NPV, and essential financial metrics.
- User-Friendly: Step-by-step guidance ensures a smooth and efficient experience.
Who Should Use KKR & Co. Inc. (KKR)?
- Finance Students: Explore private equity strategies and apply them to real-world scenarios.
- Academics: Utilize KKR’s investment models for teaching and research purposes.
- Investors: Evaluate your investment hypotheses and assess the performance of KKR’s portfolio.
- Analysts: Enhance your analysis with a tailored framework for evaluating private equity investments.
- Small Business Owners: Understand how large investment firms like KKR assess and manage their assets.
What the Template Contains
- Historical Data: Includes KKR & Co. Inc.'s (KKR) past financials and baseline forecasts.
- DCF and Levered DCF Models: Detailed templates to calculate KKR & Co. Inc.'s (KKR) intrinsic value.
- WACC Sheet: Pre-built calculations for Weighted Average Cost of Capital.
- Editable Inputs: Modify key drivers like growth rates, EBITDA %, and CAPEX assumptions.
- Quarterly and Annual Statements: A complete breakdown of KKR & Co. Inc.'s (KKR) financials.
- Interactive Dashboard: Visualize valuation results and projections dynamically.
Disclaimer
All information, articles, and product details provided on this website are for general informational and educational purposes only. We do not claim any ownership over, nor do we intend to infringe upon, any trademarks, copyrights, logos, brand names, or other intellectual property mentioned or depicted on this site. Such intellectual property remains the property of its respective owners, and any references here are made solely for identification or informational purposes, without implying any affiliation, endorsement, or partnership.
We make no representations or warranties, express or implied, regarding the accuracy, completeness, or suitability of any content or products presented. Nothing on this website should be construed as legal, tax, investment, financial, medical, or other professional advice. In addition, no part of this site—including articles or product references—constitutes a solicitation, recommendation, endorsement, advertisement, or offer to buy or sell any securities, franchises, or other financial instruments, particularly in jurisdictions where such activity would be unlawful.
All content is of a general nature and may not address the specific circumstances of any individual or entity. It is not a substitute for professional advice or services. Any actions you take based on the information provided here are strictly at your own risk. You accept full responsibility for any decisions or outcomes arising from your use of this website and agree to release us from any liability in connection with your use of, or reliance upon, the content or products found herein.