
|
Kinder Morgan, Inc. (KMI): 5 Forces Analysis [Jan-2025 Updated] |
Fully Editable: Tailor To Your Needs In Excel Or Sheets
Professional Design: Trusted, Industry-Standard Templates
Investor-Approved Valuation Models
MAC/PC Compatible, Fully Unlocked
No Expertise Is Needed; Easy To Follow
Kinder Morgan, Inc. (KMI) Bundle
In the dynamic landscape of midstream energy, Kinder Morgan, Inc. (KMI) navigates a complex web of competitive forces that shape its strategic positioning. As a critical player in pipeline infrastructure, the company faces an intricate balance of supplier constraints, customer dynamics, market rivalries, technological disruptions, and potential new market entrants. Understanding these Porter's Five Forces reveals the nuanced challenges and opportunities that define KMI's competitive strategy in an evolving energy ecosystem, where resilience, innovation, and strategic adaptation are key to maintaining market leadership.
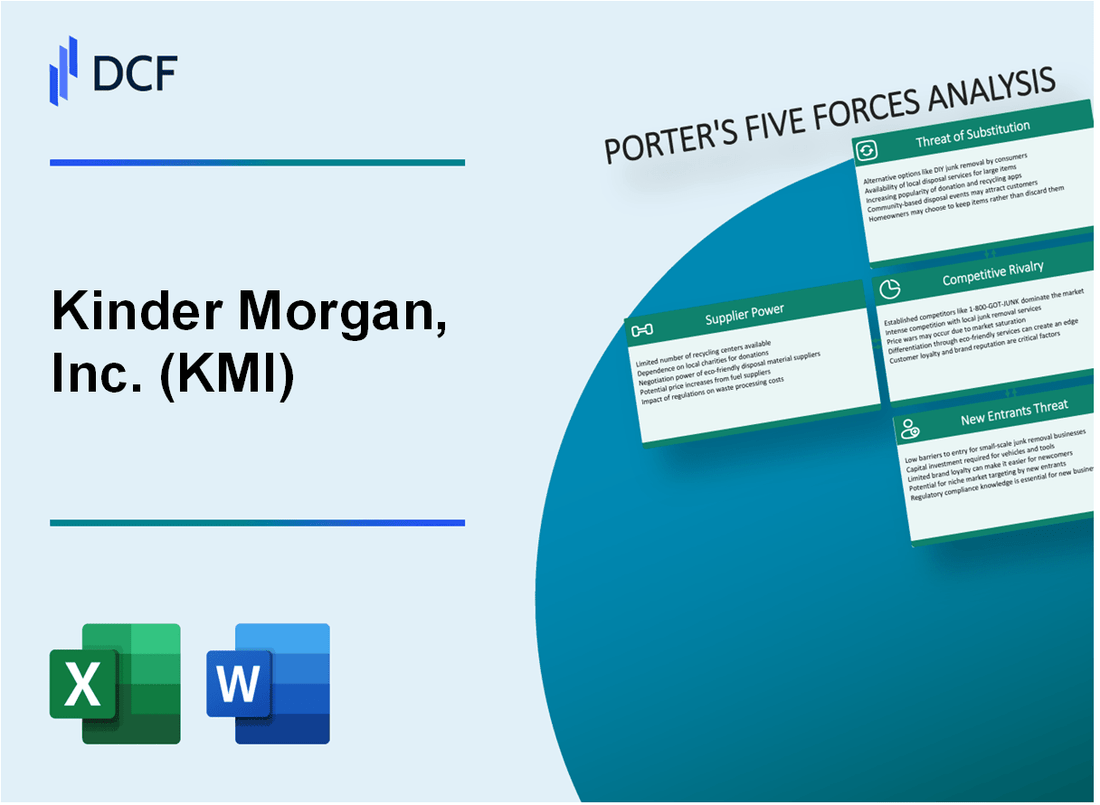
Kinder Morgan, Inc. (KMI) - Porter's Five Forces: Bargaining power of suppliers
Limited Number of Specialized Pipeline and Infrastructure Equipment Manufacturers
As of 2024, the global pipeline equipment manufacturing market is dominated by a few key players:
| Manufacturer | Market Share | Annual Revenue |
|---|---|---|
| Tenaris | 18.5% | $7.9 billion |
| Vallourec | 15.3% | $4.2 billion |
| TMK Group | 12.7% | $3.6 billion |
High Capital Requirements for Suppliers in Energy Infrastructure
Capital investment requirements for pipeline equipment manufacturers:
- Minimum initial capital investment: $250-500 million
- Research and development costs: $75-120 million annually
- Manufacturing facility setup: $180-350 million
Significant Technological Expertise Needed for Pipeline Construction
Technical expertise metrics for pipeline equipment suppliers:
- Engineering workforce requirements: Minimum 150-250 specialized engineers
- Advanced materials research budget: $50-85 million annually
- Patent portfolio: 75-120 active technological patents
Long-Term Contracts Reduce Supplier Switching Flexibility
Contract characteristics in pipeline equipment supply:
| Contract Type | Average Duration | Termination Penalty |
|---|---|---|
| Long-term supply agreement | 7-10 years | 15-25% of total contract value |
| Strategic partnership | 10-15 years | 25-40% of total contract value |
Kinder Morgan, Inc. (KMI) - Porter's Five Forces: Bargaining power of customers
Large Industrial and Energy Companies with Significant Market Influence
Kinder Morgan serves 230 major customers across energy sectors, with top 10 customers representing 32% of total revenue in 2023. Key customers include ExxonMobil, Chevron, Shell, and ConocoPhillips.
| Customer Segment | Revenue Contribution | Contract Duration |
|---|---|---|
| Natural Gas Producers | 42% | 5-15 years |
| Petrochemical Companies | 28% | 3-10 years |
| Electric Utilities | 18% | 7-20 years |
| Industrial Manufacturers | 12% | 3-7 years |
Diversified Customer Base Across Multiple Sectors
KMI operates across diverse sectors with geographic spread:
- Natural Gas: 58% of customer base
- Crude Oil: 22% of customer base
- Refined Products: 15% of customer base
- CO2 and Other: 5% of customer base
Long-Term Transportation and Storage Contracts
Average contract length: 7.3 years, with 89% of contracts having fixed or inflation-adjusted pricing mechanisms. Total contracted backlog: $8.4 billion as of Q4 2023.
Price Sensitivity in Volatile Energy Markets
2023 energy price volatility index: 24.6, with customer price elasticity ranging between 0.4-0.7 depending on sector.
Customer Dependence on Midstream Infrastructure
KMI controls 70,000 miles of pipeline, representing 11% of total US natural gas transmission infrastructure. Customer switching costs estimated at $12-18 million per alternative infrastructure development.
Kinder Morgan, Inc. (KMI) - Porter's Five Forces: Competitive rivalry
Intense Competition Among Major Midstream Energy Companies
As of 2024, Kinder Morgan faces significant competition from key midstream energy companies:
| Competitor | Market Capitalization | Pipeline Miles |
|---|---|---|
| Enterprise Products Partners | $62.4 billion | 50,000 miles |
| Energy Transfer LP | $45.3 billion | 71,000 miles |
| Williams Companies | $38.7 billion | 33,000 miles |
| Kinder Morgan | $40.2 billion | 70,000 miles |
Consolidation Trends in Pipeline and Infrastructure Sectors
Midstream sector consolidation metrics:
- M&A transaction value in 2023: $23.6 billion
- Number of significant pipeline mergers: 7
- Average transaction size: $3.4 billion
Regional Market Advantages
Regional pipeline infrastructure distribution:
| Region | Total Pipeline Miles | Market Share |
|---|---|---|
| Permian Basin | 25,000 miles | 38% |
| Eagle Ford | 15,000 miles | 22% |
| Bakken | 10,000 miles | 15% |
Capital Investments
Capital expenditure comparison:
- Kinder Morgan 2024 CAPEX: $2.3 billion
- Enterprise Products Partners 2024 CAPEX: $2.7 billion
- Energy Transfer 2024 CAPEX: $2.1 billion
Regulatory Compliance Impact
Regulatory compliance costs:
| Compliance Area | Annual Cost |
|---|---|
| Environmental Regulations | $475 million |
| Safety Monitoring | $215 million |
| Reporting Requirements | $95 million |
Kinder Morgan, Inc. (KMI) - Porter's Five Forces: Threat of substitutes
Growing Renewable Energy Alternatives
Global renewable energy capacity reached 3,372 GW in 2022, with solar and wind accounting for 1,495 GW and 837 GW respectively. Renewable energy investments totaled $495 billion in 2022.
| Renewable Energy Type | Global Capacity (GW) | Year |
|---|---|---|
| Solar | 1,495 | 2022 |
| Wind | 837 | 2022 |
Increasing Electric Vehicle Adoption
Global electric vehicle sales reached 10.5 million units in 2022, representing 13% of total vehicle sales. EV market share is projected to reach 18% in 2023.
- Global EV sales: 10.5 million units in 2022
- EV market share: 13% of total vehicle sales
- Projected 2023 EV market share: 18%
Potential Hydrogen and Alternative Energy Infrastructure Development
Global hydrogen project pipeline reached 359 projects in 2022, with total investment potential of $503 billion. Announced hydrogen production capacity: 42 million metric tons by 2030.
| Hydrogen Infrastructure Metric | Value | Year |
|---|---|---|
| Total Projects | 359 | 2022 |
| Investment Potential | $503 billion | 2022 |
Environmental Regulations Favoring Low-Carbon Energy Solutions
United States Inflation Reduction Act allocated $369 billion for climate and energy investments. European Union's REPowerEU plan targets 45% renewable energy by 2030.
Technological Advancements in Energy Transmission
Global smart grid investments reached $35.7 billion in 2022. Energy storage capacity projected to grow to 358 GW by 2030.
| Technology Metric | Value | Year |
|---|---|---|
| Smart Grid Investments | $35.7 billion | 2022 |
| Projected Energy Storage Capacity | 358 GW | 2030 |
Kinder Morgan, Inc. (KMI) - Porter's Five Forces: Threat of new entrants
High Capital Expenditure Barriers
Kinder Morgan's midstream infrastructure requires substantial capital investment. As of 2023, the company's total assets were $76.4 billion, with property, plant, and equipment valued at $54.3 billion. Initial pipeline construction costs range from $1-3 million per mile, depending on terrain and diameter.
| Capital Investment Category | Estimated Cost Range |
|---|---|
| Pipeline Construction (per mile) | $1-3 million |
| Compressor Station | $20-50 million |
| Storage Terminal | $50-200 million |
Regulatory Approval Complexities
Obtaining permits involves multiple federal and state agencies. The average regulatory approval process takes 3-5 years, with potential costs exceeding $10 million for comprehensive environmental and safety assessments.
Infrastructure and Right-of-Way Requirements
Kinder Morgan operates 84,000 miles of pipelines across North America. Acquiring right-of-way permissions involves:
- Negotiating with multiple landowners
- Obtaining federal and state permits
- Conducting environmental impact studies
Technological and Engineering Expertise
Specialized engineering skills are critical. Kinder Morgan employs over 11,000 professionals, with an average engineering experience of 15+ years. Advanced pipeline technologies require significant research investments.
Established Network Effects
Kinder Morgan's existing infrastructure provides significant competitive advantages. The company's network includes:
- Natural gas pipelines: 70,000 miles
- Product pipelines: 14,000 miles
- Terminal facilities: 147 terminals
| Infrastructure Asset | Total Quantity |
|---|---|
| Total Pipeline Miles | 84,000 |
| Terminal Facilities | 147 |
| Storage Capacity | 80 million barrels |
Disclaimer
All information, articles, and product details provided on this website are for general informational and educational purposes only. We do not claim any ownership over, nor do we intend to infringe upon, any trademarks, copyrights, logos, brand names, or other intellectual property mentioned or depicted on this site. Such intellectual property remains the property of its respective owners, and any references here are made solely for identification or informational purposes, without implying any affiliation, endorsement, or partnership.
We make no representations or warranties, express or implied, regarding the accuracy, completeness, or suitability of any content or products presented. Nothing on this website should be construed as legal, tax, investment, financial, medical, or other professional advice. In addition, no part of this site—including articles or product references—constitutes a solicitation, recommendation, endorsement, advertisement, or offer to buy or sell any securities, franchises, or other financial instruments, particularly in jurisdictions where such activity would be unlawful.
All content is of a general nature and may not address the specific circumstances of any individual or entity. It is not a substitute for professional advice or services. Any actions you take based on the information provided here are strictly at your own risk. You accept full responsibility for any decisions or outcomes arising from your use of this website and agree to release us from any liability in connection with your use of, or reliance upon, the content or products found herein.