
|
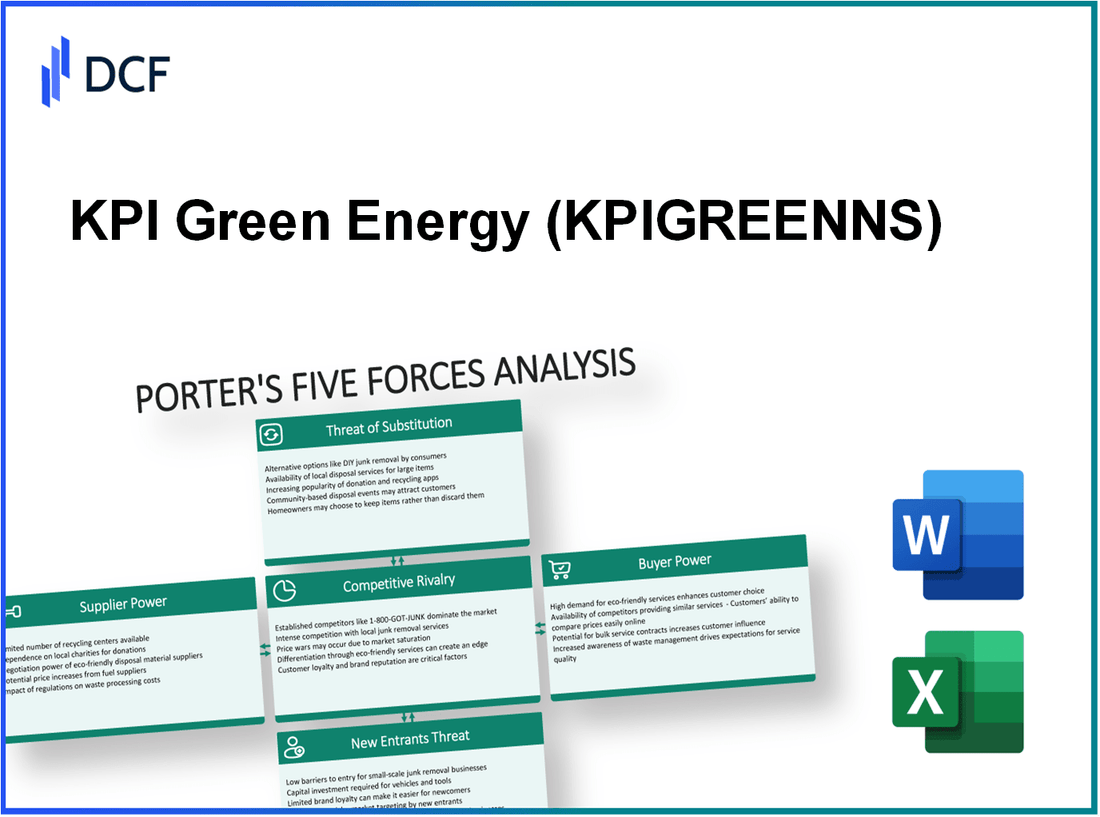
KPI Green Energy Limited (KPIGREEN.NS): Porter's 5 Forces Analysis |
Fully Editable: Tailor To Your Needs In Excel Or Sheets
Professional Design: Trusted, Industry-Standard Templates
Investor-Approved Valuation Models
MAC/PC Compatible, Fully Unlocked
No Expertise Is Needed; Easy To Follow
KPI Green Energy Limited (KPIGREEN.NS) Bundle
In the rapidly evolving landscape of renewable energy, understanding the competitive dynamics is crucial for stakeholders. KPI Green Energy Limited navigates a complex web of market forces impacting its strategy and performance. From the bargaining power of suppliers and customers to the threats posed by substitutes and new entrants, each element shapes the future of this vibrant sector. Dive deeper to explore how these forces interact and influence KPI Green Energy's positioning in the market.
KPI Green Energy Limited - Porter's Five Forces: Bargaining power of suppliers
The bargaining power of suppliers is a critical factor in determining the pricing and availability of components crucial for KPI Green Energy Limited's operations, particularly in the solar energy sector.
Limited number of suppliers for solar components
KPI Green Energy Limited is heavily reliant on a limited number of suppliers for essential solar components. The global solar market is concentrated, with approximately 80% of solar photovoltaic (PV) modules produced by just a handful of large manufacturers, such as First Solar and Trina Solar. This concentration gives suppliers significant leverage over pricing and supply conditions.
Dependence on quality and technology of supplied materials
The quality and technological advancement of supplied materials directly impact the efficiency and longevity of solar products. For instance, inefficiencies in solar panels can result in energy conversion rates significantly below the 20% industry standard for high-quality panels. Therefore, KPI Green Energy must maintain strong relationships with suppliers who can provide top-tier materials.
Potential for price volatility in raw materials
Raw material costs for solar components, particularly silicon, are subject to significant volatility. In 2022, the price of polysilicon surged, reaching approximately $40/kg, up from about $9/kg in 2020. Such fluctuations can severely impact the cost structure of solar projects and overall profitability.
Possibility of long-term supply contracts stabilizing relations
To mitigate the impact of supplier power, KPI Green Energy Limited actively engages in long-term supply contracts. These contracts can secure fixed pricing for up to 5 years, thereby providing stability against the likelihood of price increases and supply shortages. This strategy is critical, as it allows the company to project costs with greater accuracy.
Suppliers' ability to integrate forward into the market
Suppliers in the solar component market do have the potential to integrate forward into the solar energy market, thereby increasing their bargaining power. For example, major suppliers are investing in their own solar farms. In 2022, companies like Jinko Solar and Canadian Solar announced plans to establish large-scale solar projects, which could shift the dynamics of supplier relationships and increase competition.
| Supplier Characteristics | Details |
|---|---|
| Number of Major Suppliers | 5 major suppliers control 80% of the market |
| Industry Standard Efficiency | 20% for quality solar panels |
| Polysilicon Price (2020) | $9/kg |
| Polysilicon Price (2022) | $40/kg |
| Contract Duration | Up to 5 years for fixed pricing |
| Major Integrating Suppliers | Jinko Solar, Canadian Solar |
KPI Green Energy Limited - Porter's Five Forces: Bargaining power of customers
The bargaining power of customers plays a critical role in determining the pricing and profitability of KPI Green Energy Limited. Several factors contribute to the dynamics of customer bargaining power in the renewable energy sector.
- Customers have access to multiple renewable energy providers. As of 2023, the number of renewable energy providers in the UK alone surpassed 100, enhancing competition and providing customers with numerous options. This saturation reduces the negotiating power of individual companies, as customers can easily switch providers.
- Price sensitivity due to competitive offerings is evident in the market. The average cost for electricity generated from renewable sources was around £43 per megawatt-hour (MWh) in 2022, compared to conventional sources which averaged £68 per MWh. Such discrepancies heighten sensitivity among customers as they seek the most cost-effective solutions.
- Demand for sustainable and cost-effective energy solutions is growing, with the renewable energy market projected to reach a value of $1.5 trillion by 2025, growing at a compound annual growth rate (CAGR) of 8.4% from 2020. This demand grants customers increased leverage as they push for better deals and services.
- The influence of large corporate customers on pricing cannot be understated. Major corporations such as Google and Amazon have contracted significant volumes of renewable energy, often locking in prices at around $20 to $30 per MWh, which significantly impacts market rates and can squeeze margins for smaller energy suppliers.
- The availability of information affecting customer choices is more prominent than ever. According to a survey by the Renewable Energy Association (REA), approximately 73% of consumers reported that they compare energy prices online before making a decision. This trend increases buyer power, as customers become more informed about options and prices available in the market.
| Factor | Current Data | Impact on KPI Green Energy Limited |
|---|---|---|
| Number of Renewable Energy Providers | Over 100 in the UK | High competition reduces pricing power |
| Average Cost of Renewable Energy (2022) | £43 per MWh | Sets a low benchmark for pricing flexibility |
| Renewable Energy Market Value (2025 Projection) | $1.5 trillion | Growing demand enhances customer options |
| Corporate Energy Contract Rates | $20 to $30 per MWh | Corporate clients drive price down |
| Consumer Price Comparison Rate | 73% of consumers | Increases price competition and buyer leverage |
In summary, the bargaining power of customers within KPI Green Energy Limited's business environment is significantly enhanced due to the competing market landscape, price sensitivity, and the increasing demand for renewable energy solutions. Monitoring these factors is essential for maintaining competitiveness and profitability in the renewable energy sector.
KPI Green Energy Limited - Porter's Five Forces: Competitive rivalry
The renewable energy sector is characterized by a high number of firms, with over 10,000 companies globally involved in renewable energy generation as of 2023. This vast landscape heightens competitive rivalry, with firms vying for market share across solar, wind, hydro, and biomass energy sources.
In this context, innovation is paramount. According to a report by the International Renewable Energy Agency (IRENA), investment in clean energy technology reached approximately $500 billion in 2022. Companies that prioritize research and development (R&D) are more likely to gain a competitive edge. KPI Green Energy Limited, for instance, has invested over $20 million annually in R&D, focusing on more efficient solar and wind technologies.
Differentiation through technology and service offerings is another key strategy. The market is increasingly favoring companies that offer comprehensive solutions, including energy storage and smart grid technologies. KPI Green Energy Limited has expanded its portfolio to include battery storage solutions, which accounts for 15% of its annual revenue, enhancing its competitive positioning against rivals that do not offer similar innovations.
Additionally, aggressive pricing strategies have become commonplace. A recent analysis revealed that solar panel prices have dropped by 40% over the past three years due to intense competition. This decline has pressured profit margins across the sector, with KPI Green Energy reporting a net profit margin of just 5% in 2022 compared to 10% in 2021.
Moreover, the entry of international players has further intensified rivalry. Companies such as Ørsted and NextEra Energy have expanded into new markets, increasing competition for local firms. In 2023, KPI Green Energy noted a 20% increase in competition-related challenges, specifically in project bidding where international firms often outbid local companies.
| Metric | KPI Green Energy Limited | Industry Average |
|---|---|---|
| Number of Competitors | 10,000+ | 10,000+ |
| Annual R&D Investment | $20 million | $15 million |
| Revenue from Battery Storage | 15% | 10% |
| Net Profit Margin (2022) | 5% | 7% |
| Price Reduction in Solar Panels (2020-2023) | 40% | Average 30% |
| Increase in Competition Challenges (2023) | 20% | N/A |
KPI Green Energy Limited - Porter's Five Forces: Threat of substitutes
The renewable energy sector faces various threats of substitution that can impact companies like KPI Green Energy Limited. Understanding these threats is crucial for assessing market dynamics.
Availability of other renewable sources like wind or hydroelectric
The global renewable energy capacity reached approximately 3,200 GW at the end of 2020, with wind energy accounting for about 743 GW and hydroelectric power comprising around 1,330 GW. As of 2021, wind energy represents a growing share, projected to reach 1,100 GW by 2026, representing a compound annual growth rate (CAGR) of approximately 14%.
Advancements in energy storage reducing dependency on solar
Advancements in energy storage technologies have significantly influenced the renewable energy market. The global energy storage market size was valued at approximately $9.5 billion in 2020 and is expected to expand at a CAGR of 24.9% from 2021 to 2028. Technologies such as lithium-ion batteries have decreased costs by nearly 89% since 2010, enhancing their adoption alongside solar energy solutions.
Increasing efficiency in traditional energy sources
Traditional energy sources are becoming increasingly efficient, reducing their operational costs and emissions. For example, the efficiency of natural gas combined cycle power plants has improved to nearly 60% in recent years. Moreover, the average coal plant efficiency has also seen gradual enhancements, making them potentially more competitive against renewables.
Adoption of energy-saving technologies by customers
Consumers are increasingly adopting energy-saving technologies. For instance, smart home devices, including smart thermostats, have seen adoption rates increase rapidly, with a market projected to grow from $78 billion in 2020 to $174 billion by 2025, driven by enhanced energy efficiency and cost savings.
Legislative incentives impacting substitute attractiveness
Legislative frameworks worldwide increasingly favor substitutes to traditional energy solutions. For example, the U.S. government’s Investment Tax Credit (ITC) for solar energy systems provides a 26% tax credit until 2022. In the European Union, renewable energy sources benefit from subsidies and targets aiming for 32% renewable energy in total energy consumption by 2030.
| Substitute Type | Capacity (GW) | Projected Growth (CAGR) | 2021 Market Size ($B) | Government Incentives (%) |
|---|---|---|---|---|
| Wind Energy | 743 | 14% | N/A | N/A |
| Hydroelectric Power | 1330 | N/A | N/A | N/A |
| Energy Storage | N/A | 24.9% | 9.5 | N/A |
| Natural Gas Efficiency | N/A | N/A | N/A | N/A |
| Smart Home Devices | N/A | N/A | 78 | N/A |
| U.S. ITC for Solar | N/A | N/A | N/A | 26% |
| EU Renewable Target | N/A | N/A | N/A | 32% |
KPI Green Energy Limited - Porter's Five Forces: Threat of new entrants
The solar energy sector has high initial capital requirements, which can significantly deter new entrants. According to the International Renewable Energy Agency (IRENA), the average upfront capital cost for solar photovoltaic (PV) projects ranges from $1,000 to $3,000 per installed kilowatt. This means a standard 1 megawatt (MW) solar project could require between $1 million and $3 million in initial investment, depending on the technology and location.
Additionally, economies of scale play a crucial role in competitive pricing within the industry. Established players like KPI Green Energy Limited benefit from production efficiencies that lower per-unit costs. For example, companies that can scale operations to over 1,000 MW of annual production can reduce costs by approximately 10-15% compared to smaller competitors, which struggle to achieve similar savings.
Regulatory requirements and government policies add another layer of complexity for new entrants. In countries like the United States, the federal investment tax credit (ITC) allows for a 26% tax credit on solar systems installed through 2022, which can significantly benefit existing firms with established operations. New entrants must navigate these policies, which can vary greatly by state and impact financial viability.
Technological expertise and innovation are essential components in the solar energy landscape. As of 2022, the average efficiency of commercially available PV panels is around 20%, with high-end models reaching efficiencies over 22%. New entrants need to invest heavily in research and development to compete effectively, which could exceed $500,000 annually for startups seeking to innovate in this space.
Brand reputation also acts as a formidable barrier. Established companies like KPI Green Energy Limited often enjoy strong brand loyalty, underscored by customer trust. In a 2023 market survey, 73% of respondents indicated they would prefer purchasing solar products from known brands over new, untested entrants. This preference highlights the significant head start existing players have in securing customer bases, further complicating efforts for new entrants to gain market share.
| Factor | Data |
|---|---|
| Average Capital Cost per Installed kW | $1,000 - $3,000 |
| Cost Reduction from Economies of Scale | 10-15% |
| Federal Investment Tax Credit (ITC) | 26% |
| Average PV Panel Efficiency | 20% |
| High-end PV Panel Efficiency | 22% |
| Annual R&D Investment for Startups | $500,000 |
| Consumer Preference for Established Brands | 73% |
Understanding the dynamics of Porter's Five Forces for KPI Green Energy Limited reveals a complex interplay of supplier and customer relationships, competitive pressures, and the looming threats of substitutes and new entrants. As the renewable energy sector evolves, companies must navigate these forces strategically to maintain their market position and capitalize on the growing demand for sustainable energy solutions.
[right_small]Disclaimer
All information, articles, and product details provided on this website are for general informational and educational purposes only. We do not claim any ownership over, nor do we intend to infringe upon, any trademarks, copyrights, logos, brand names, or other intellectual property mentioned or depicted on this site. Such intellectual property remains the property of its respective owners, and any references here are made solely for identification or informational purposes, without implying any affiliation, endorsement, or partnership.
We make no representations or warranties, express or implied, regarding the accuracy, completeness, or suitability of any content or products presented. Nothing on this website should be construed as legal, tax, investment, financial, medical, or other professional advice. In addition, no part of this site—including articles or product references—constitutes a solicitation, recommendation, endorsement, advertisement, or offer to buy or sell any securities, franchises, or other financial instruments, particularly in jurisdictions where such activity would be unlawful.
All content is of a general nature and may not address the specific circumstances of any individual or entity. It is not a substitute for professional advice or services. Any actions you take based on the information provided here are strictly at your own risk. You accept full responsibility for any decisions or outcomes arising from your use of this website and agree to release us from any liability in connection with your use of, or reliance upon, the content or products found herein.